
Guide
Environmental Monitoring: An In-Depth Guide [New for 2025]
Environmental monitoring (EM) is the ongoing measurement and analysis of environmental conditions to protect products and operations—and keep people safe.
→ Jump to the top environmental monitoring tools of 2025.
The most commonly monitored conditions include air, water, noise, temperature, humidity, particles, and gases.
The goal is simple: turn measurements into decisions that improve safety, compliance, quality, uptime, and community outcomes, while reducing risk and cost.
EM shows up across indoor and outdoor environments.
- Inside, you’ll see it in pharmaceutical cleanrooms and labs, data centers and server rooms, office buildings and warehouses, food and beverage facilities, and healthcare settings.
- Outside, it supports industrial plants and utilities, construction and mining sites, ports and transportation corridors, landfills and remediation projects, campuses and municipalities, and community/ambient networks.
Environmental monitoring programs may use a host of methods, including spot checks or continuous sensing, single handheld instruments or networked systems. Often, several of these are used in combination to create reliable situational awareness.
Environmental monitoring is also commonly called:
- Environmental surveillance
- Continuous emissions monitoring (CEM/CEMS)
- Ambient monitoring
- Indoor air quality (IAQ) / indoor environmental quality (IEQ) monitoring
This guide covers the four core types of environmental monitoring, EM tools, devices, and end-to-end systems, where AI can help (and where it can’t), and how different industries put EM into practice.
Use the menu to the right to jump around, or keep reading for the full guide.
Best Environmental Monitoring Devices on the Market [New for 2025]
Want to buy or rent a dust monitor? Or looking for other environmental monitoring tools?
Here are some of the top EM tools on the market right now, organized by type.
Air Quality Networks & Ambient Mapping
1. Bettair Air Quality Mapping System—Dust and Air Pollution Monitor
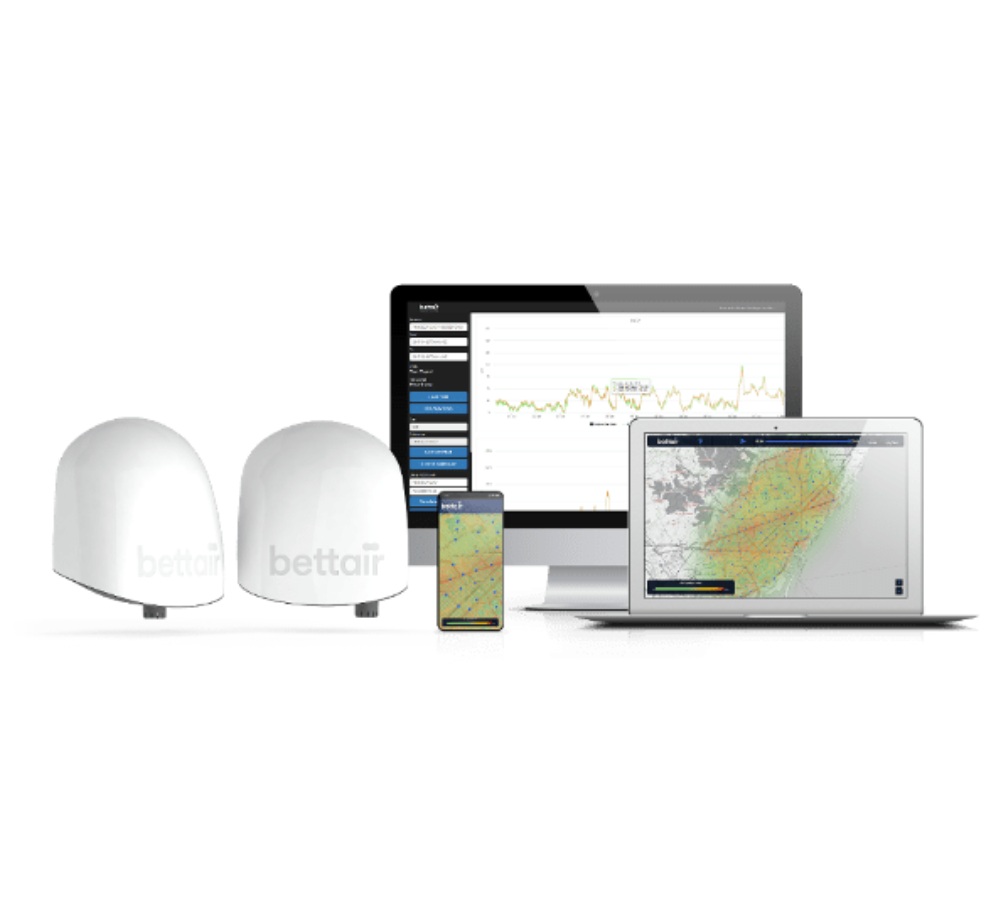
The Bettair Air Quality Mapping System provides advanced, high-resolution air quality data using a network of smart sensors that monitor particulate matter (PM1, PM2.5, PM10) and key gases such as NO₂, CO, and O₃.
Designed for cities, industrial zones, and environmental agencies, Bettair offers real-time mapping and analytics to identify pollution sources and trends across large areas.
- High-accuracy particulate monitoring. Tracks PM1, PM2.5, and PM10 concentrations with precision sensors.
- Smart network integration. Connects multiple units for continuous, georeferenced air quality mapping.
- Advanced analytics. Cloud platform provides data visualization, trend analysis, and compliance reporting.
- Low-maintenance design. Long-life sensors with remote calibration and automated diagnostics.
Buy or Rent the dnota Bettair Air Quality Mapping System.
Airflow & Ventilation Verification
2. TSI VelociCalc 9515—Air Velocity Meter
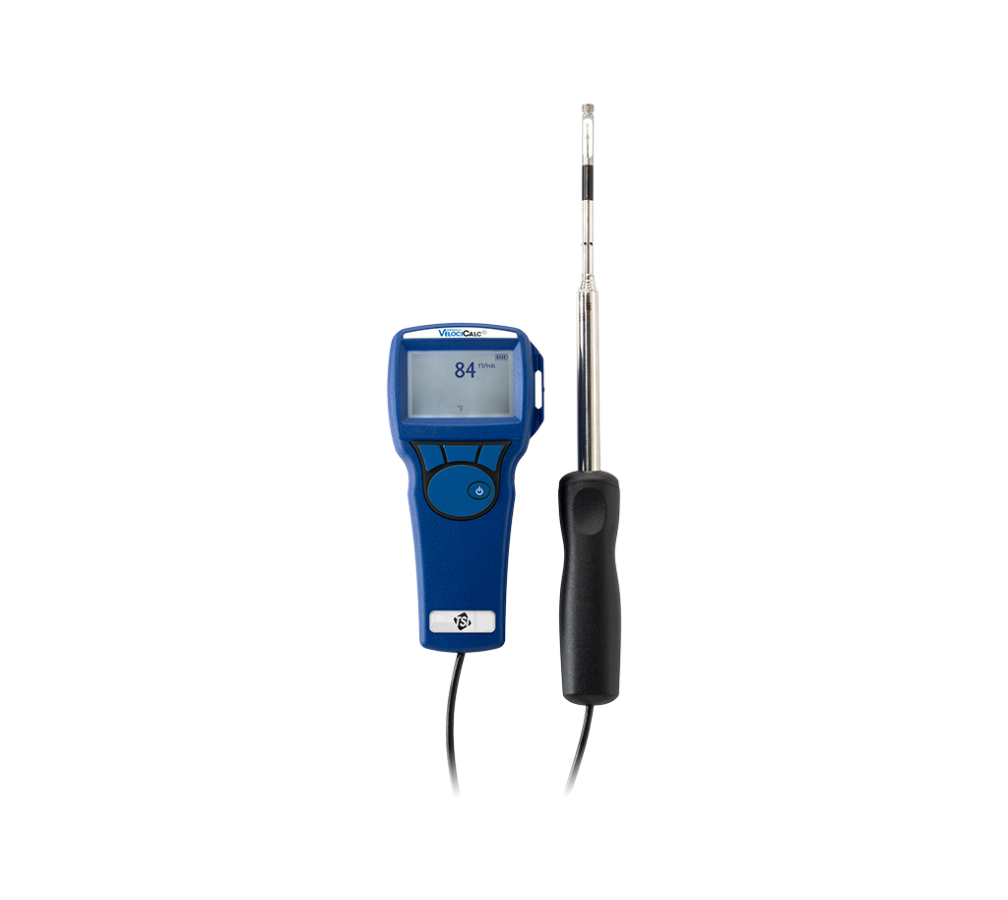
The TSI VelociCalc 9515 measures air velocity and temperature to verify ventilation performance and capture airflow data in dust-prone environments.
Its digital display and ergonomic probe make it ideal for HVAC testing, cleanroom certification, and process ventilation checks.
- Accurate airflow measurement. Measures air velocity from 0 to 4,000 fpm (20 m/s).
- Easy operation. Simple keypad navigation with real-time data display.
- Field durability. Rugged handheld design for use in industrial settings.
- Traceable calibration. NIST-certified accuracy for regulatory reporting.
Rent the TSI VelociCalc 9515 Air Velocity Meter.
Gas Detection & VOC Monitoring
3. RAE Systems MultiRAE Lite—Multi-Gas Detector
The MultiRAE Lite is a compact, portable gas detector capable of measuring up to six gases simultaneously.
It supports sensors for VOCs, O₂, CO, H₂S, and combustibles, making it a reliable tool for confined spaces, leak detection, and industrial air-quality monitoring.
- Versatile detection. Configurable for up to six gas sensors.
- Rugged portability. Designed for harsh industrial and field conditions.
- Smart safety alerts. Real-time audible and visual alarms for hazardous levels.
- Data logging. Integrated storage and PC connectivity for compliance records.
Buy or rent the RAE Systems MultiRAE Lite.
4. RAE Systems MiniRAE 3000 PID — VOC Monitor
The MiniRAE 3000 is a rugged photoionization detector (PID) for real-time VOC measurement across an exceptionally wide range.
It pairs well with dust monitoring by revealing gaseous co-contaminants during maintenance, turnarounds, or complaint investigations, and it’s built for harsh industrial environments.
- Broad measurement range. Detects VOCs from 0.1 to 15,000 ppm for survey and leak-tracking work.
- Fast response. Immediate readings to pinpoint sources and guide controls in the field.
- Industrial durability. Intrinsically safe design for refineries, chemical plants, and confined spaces.
- Data workflow. Onboard logging and download options to support incident documentation.
Buy or rent the RAE Systems MiniRAE 3000 PID.
Heat Stress (WBGT) & Microclimate
5. QUESTemp 44/46/48N—Heat Stress Monitor
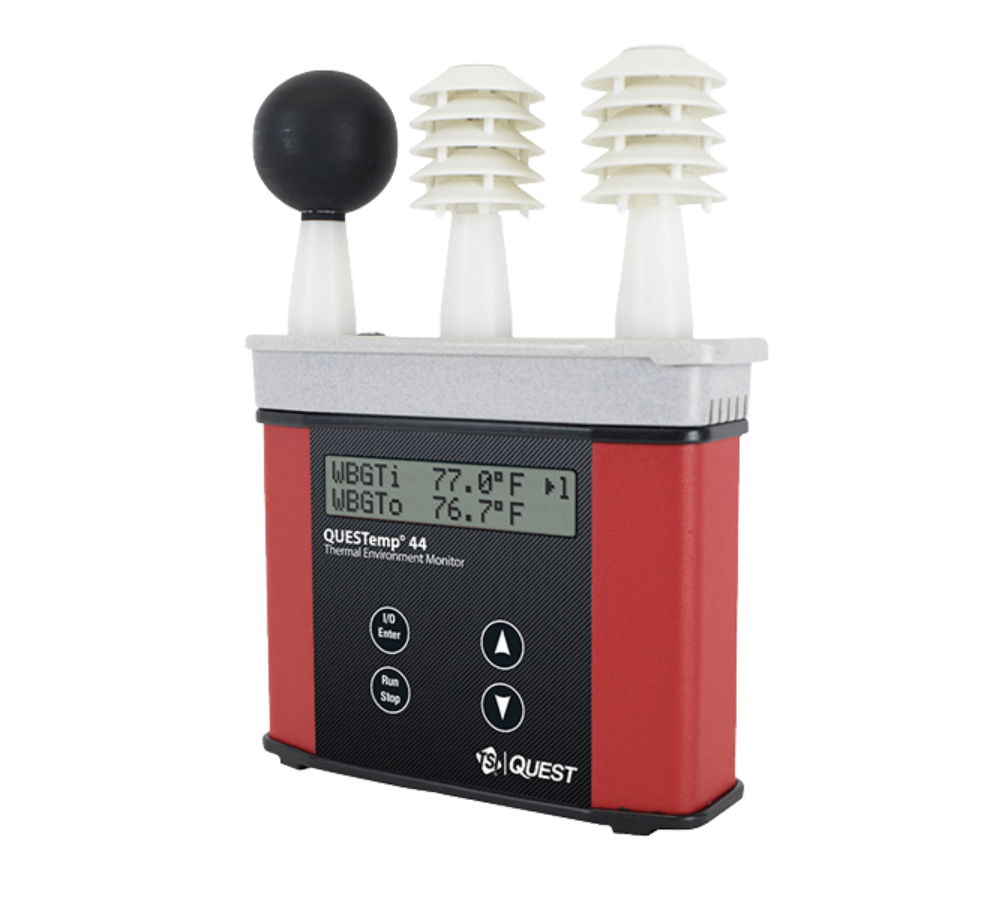
The TSI QUESTemp 44/46/48N Series provides accurate, real-time measurement of Wet Bulb Globe Temperature (WBGT), air temperature, humidity, and radiant heat.
Built for demanding industrial environments, these monitors help organizations assess thermal risk and comply with OSHA and ISO 7243 standards. Intuitive menus, quick setup, and rugged design make the QUESTemp series a trusted choice for safety professionals.
- Comprehensive heat monitoring. Simultaneously measures WBGT, air temperature, humidity, and globe temperature.
- Field-ready design. Durable housing and easy-to-read display for use in outdoor and industrial conditions.
- Data management. Onboard logging with USB transfer for analysis and reporting.
- Compliance support. Meets OSHA and ISO requirements for occupational heat exposure monitoring.
Buy or rent the TSI QUESTemp 44/46/48N Heat Stress Monitor.
Noise Exposure—Personal Dosimeters
6. Casella CEL-350IS—Noise Dosimeter
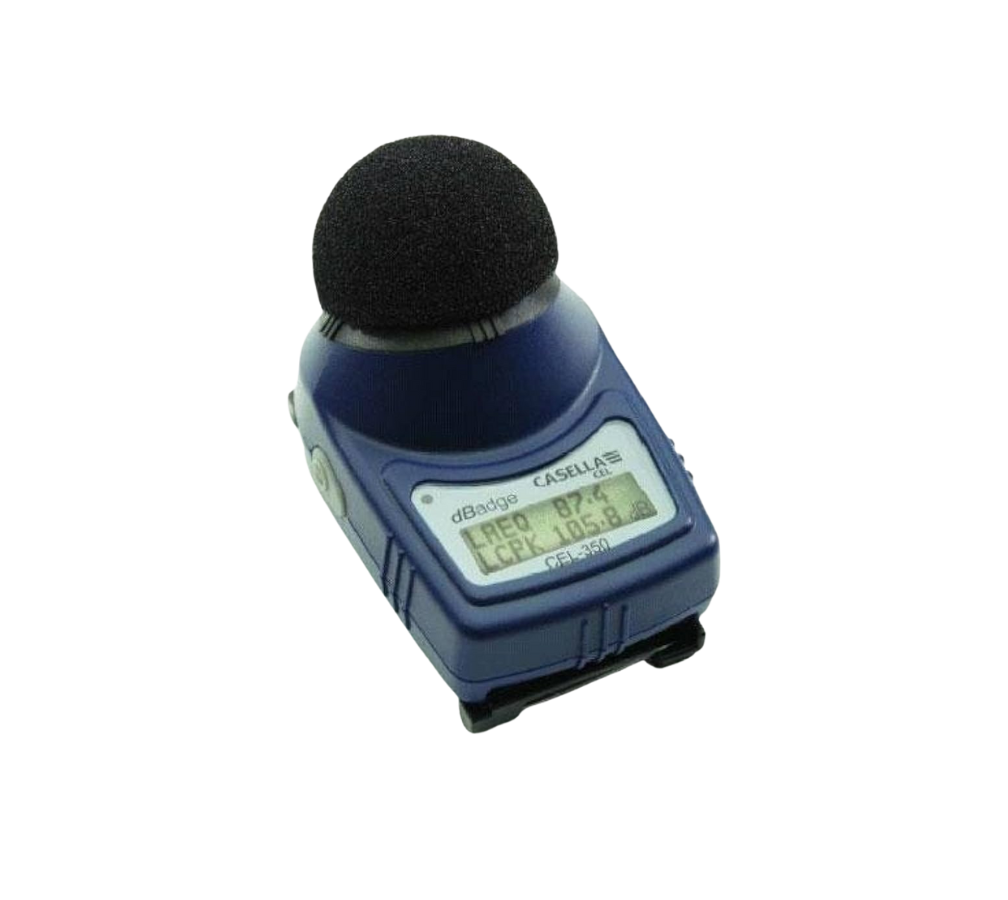
The CEL-350IS is a compact, intrinsically safe noise dosimeter that tracks a worker’s total sound exposure across an entire shift. It clips to clothing and records dose, TWA, and time-history data to help safety teams maintain compliance with OSHA and NIOSH standards.
Built for rugged industrial use, the CEL-350IS is lightweight, simple to operate, and automatically calibrates for quick deployment across multiple workers.
- Intrinsically safe. Certified for use in hazardous oil & gas, chemical, and manufacturing environments.
- Comprehensive exposure tracking. Captures dose, TWA, and time-history for hearing conservation programs.
- Compact design. Clips securely to clothing for all-day comfort.
- Auto-calibration. Compatible with standard acoustic calibrators for fast, reliable checks.
7. TSI Quest Edge 8—Noise Dosimeter
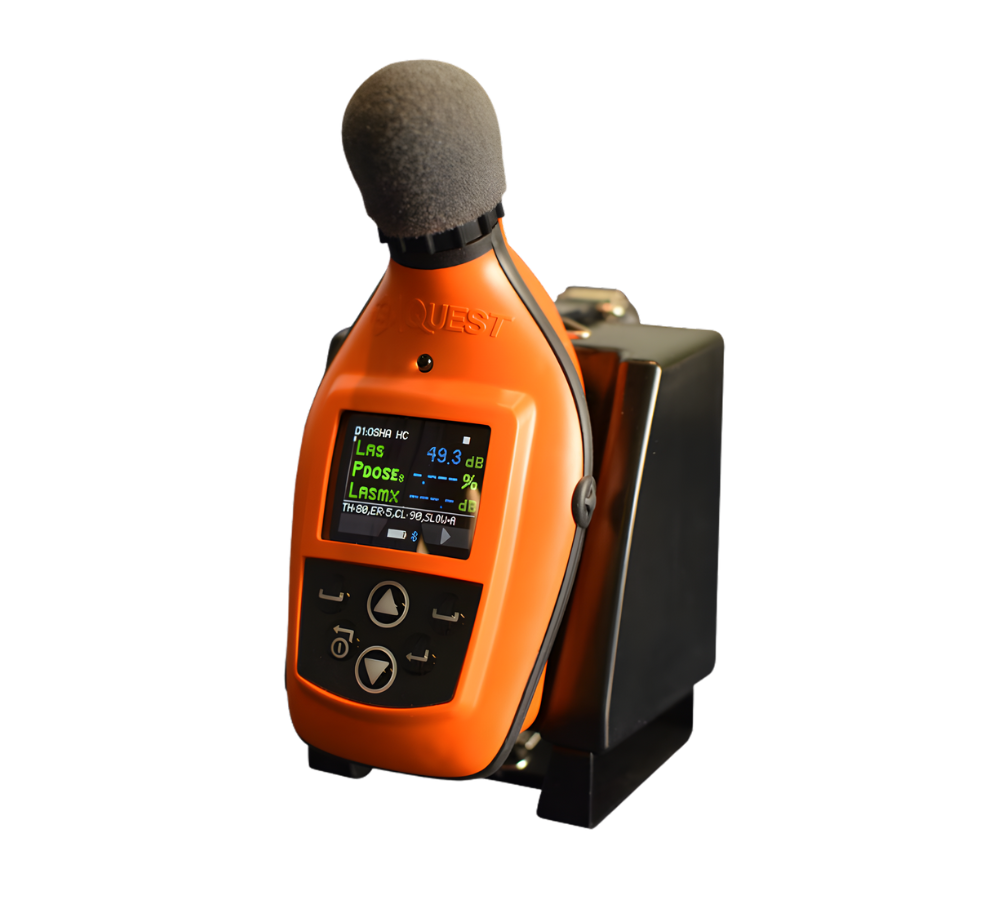
The TSI Quest Edge 8 is a compact, cable-free noise dosimeter engineered for accurate, full-shift exposure monitoring.
Designed for worker comfort and mobility, it mounts near the ear and continuously tracks personal noise levels throughout the day. Its durable housing and intuitive interface make it ideal for industrial hygiene programs in manufacturing, construction, energy, and other high-noise sectors.
- Wireless monitoring. Bluetooth connectivity enables live data viewing and remote control via mobile app.
- Dual-parameter measurement. Capture multiple exchange rates (3 dB / 5 dB) to meet OSHA, NIOSH, and ISO standards.
- Compact, cable-free design. Lightweight and easy to wear, minimizing interference during daily tasks.
- Comprehensive data logging. Stores up to 180 hours of measurements with time history for detailed analysis.
- Rugged and reliable. Intrinsically safe model available for hazardous environments (ATEX/IECEx).
Buy or rent the TSI Quest Edge 8 noise dosimeter.
Sound Level Meters (Area/Environmental)
8. Casella CEL-633.A1.K1 Kit—Sound Level Meter
The CEL-633.A1.K1 is a handheld digital sound level meter for precise environmental and occupational noise surveys. It captures real-time sound pressure levels with flexible frequency and time weightings for accurate, repeatable results in industrial settings.
- Flexible measurement. Multiple frequency and time weightings for varied survey conditions.
- Data you can use. Onboard logging with easy transfer to PC for analysis and reporting.
- Field-ready display. Backlit, high-resolution screen for low-light environments.
- Smart calibration. Calibrator recognition with automatic level adjustment.
Rent the Casella CEL-633.A1.K1 Kit.
Acoustic Imaging (Leaks & Partial Discharge)
9. Fluke SV600—Acoustic Imager
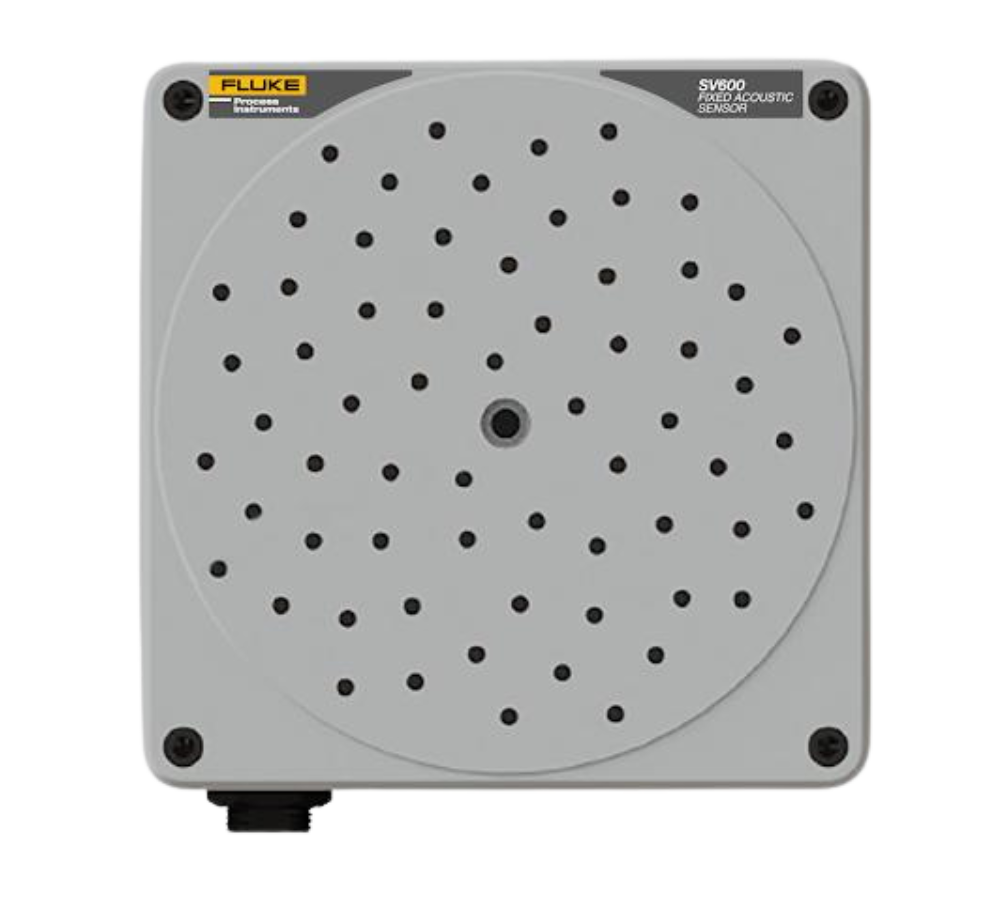
The Fluke SV600 converts sound into a visual SoundMap, helping teams detect and locate compressed-air and gas leaks or mechanical anomalies in real time. It can be fixed-mounted or integrated with robotic platforms for automated rounds.
- Visual leak detection. Real-time acoustic maps highlight leak locations.
- Automation-ready. Can be integrated with mobile robots for routine inspections.
- Predictive insights. Helps identify abnormal sound signatures before failures.
10. Crysound 2623—Acoustic Imager

The Crysound 2623 is a handheld acoustic camera that localizes sound sources for fast diagnostics. It visualizes air, gas, and vacuum leaks and supports partial discharge detection for electrical assets.
- Beamforming microphone array. Pinpoints sound sources with high confidence.
- Leak & PD detection. Supports gas-leak and electrical partial-discharge workflows.
- On-device reporting. Capture images/video and generate reports quickly.
- Rugged build. Aluminum-alloy housing for industrial environments.
Buy or rent the Crysound 2623.
11. Crysound 8124—Acoustic Imager
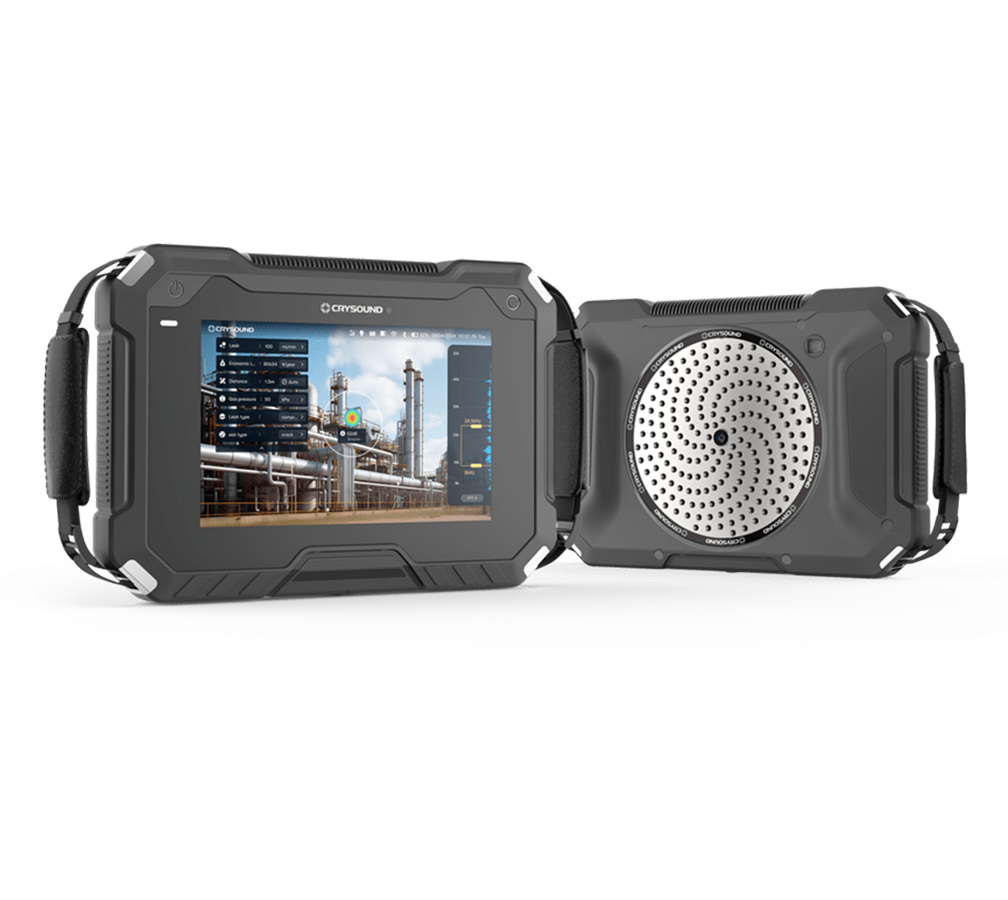
The Crysound 8124 combines a high-density microphone array with a high-resolution display to visualize leaks and electrical discharge across complex assets. It’s designed for larger inspection areas and long shifts.
- High-density array. 200-microphone design for long-range, precise localization.
- Wide bandwidth. Up to 100 kHz for faint leak and PD detection.
- Dual-mode reporting. Generates acoustic (and optional thermal) image reports.
- Field-ready display & power. 1920×1200 screen; up to 5 hours of operation.
[Related Read: Gas Leak Detection: An In-Depth Guide {New for 2025}]
What Is Environmental Monitoring?
Environmental monitoring (EM) is the ongoing collection of measurements to understand conditions in and around operations.
The most commonly measured environmental conditions include:
- Air
- Water
- Noise
- Vibration
- Temperature
- Humidity
- Particles
- Gases
- Microclimate data

The purpose of collecting and evaluating this data is to turn measurements into timely decisions that ensure safety, maintain quality, meet compliance obligations, improve reliability/uptime.
A complete EM program doesn’t just collect data. It clearly defines what to measure, where, and how often, building in quality controls and action plans to avoid dangerous levels of different types of contaminants.
Core elements of a monitoring program
Any solid EM program will include these key pieces:
- Parameters. Pollutants and indicators (e.g., PM2.5/PM10, VOCs, CO₂, noise, WBGT, pH, turbidity).
- Siting. Fixed locations, mobile routes, indoor vs. outdoor, cleanrooms vs. ambient, worker vs. area.
- Cadence. Spot checks, periodic sampling, or continuous networks with real-time alerts.
- Methods & QA/QC. Documented procedures, calibration/verification, drift checks, data validation.
- Thresholds & actions. Trigger levels, escalation paths, and corrective measures.
- Reporting. Dashboards, logs, and records for audits, stakeholders, and improvement cycles.
3 Key Components of Environmental Monitoring
Just because you’re collecting and analyzing EM data doesn’t mean you’re compliant with the relevant regulations governing your work.
When you think about doing EM well, it’s important to distinguish between getting and analyzing data and compliance. You may do the first one or even the first two well, but still not be compliant.
Here’s what you need to know:
- Monitoring is the systematic collection of measurements to characterize conditions—think sensors and sampling that build a reliable picture over time.
- Assessment is what you do with those measurements: analyzing and interpreting the data to reach conclusions, prioritize risks, and decide actions (adjust ventilation, change work practices, tune processes).
- Compliance monitoring is a specific use of monitoring designed to prove you meet laws, permits, or standards. It follows documented methods and QA/QC, keeps defensible records (timestamps, calibrations, chain of custody), and produces reports suitable for audits and regulators.
5 Reasons Environmental Monitoring Is Important
Environmental monitoring is important because it keeps people safe. Without tracking conditions in a workplace, there’s no way to know when you’re reaching critical thresholds—and if you don’t know, people can get hurt.
It’s also important because it helps you take care of your assets, keeping operations running smoothly and reliably by avoiding accidents and unplanned outages.
By measuring what matters—and alerting teams when thresholds are crossed—you reduce risk, protect people and products, and keep operations reliable.
Here are five big benefits of having a strong EM program in place.
1. Safety & Health
Safety is the top priority on job sites, and well-executed EM is crucial for helping people avoid dangerous work environments.
EM impacts safety and health by:
- Early detection of hazardous conditions (e.g., particulates, VOCs, heat, noise) to prevent injuries and illnesses.
- Enabling faster response to exceedances with clear escalation paths and documented actions.
- Better work/rest guidance and exposure management to cut incident rates.
2. Compliance & Audit Readiness
Compliance is key to keeping operations running smoothly and avoiding hefty fines.
EM impacts compliance by:
- Providing continuous evidence of adherence to internal policies and required limits.
- Ensuring traceable calibration, validation, and records that simplify audits.
- Helping you avoid penalties through proactive alerts and documented corrective actions.
3. Quality & Process Control
Quality suffers when you don’t track the conditions of your operations.
EM impacts quality by:
- Ensuring cleaner environments and tighter conditions in sensitive areas like cleanrooms and labs.
- Reducing scrap, rework, and batch failures through real-time trending.
- Helping you get fewer complaints thanks to source identification and mitigation.
4. Reliability/Uptime & Cost
Unplanned downtimes are incredibly expensive—but they can be reduced, and in some cases even eliminated.
EM impacts downtimes by:
- Leading to fewer unplanned stoppages with early warning of heat, humidity, or contamination risks.
- Saving energy by finding and fixing leaks or ventilation issues.
- Reducing staffing requirements via automated alerts and dashboards.
5. Data & Decision-Making
Data is everything when it comes to making informed decisions.
EM impacts data-driven decision-making by:
- Producing reliable baselines for setting thresholds and improvement goals.
- Giving you better models and forecasts when data are complete and validated.
The Four Types of Environmental Monitoring
Thinking about these four categories provides a practical framework for designing a thorough, reliable EM program.
But keep in mind—real-world deployments often combine multiple types at once.
At a high level, the four types of environmental monitoring are:
1. Air monitoring
2. Water monitoring
3. Noise and vibration monitoring
4. Microclimate monitoring
And sometimes people add a fifth type:
5. Waste / special hazard monitoring
This chart gives you an overview of all five types of EM:
Type | Typical parameters | Typical sources/locations | Common methods | When to use it |
---|---|---|---|---|
Air | PM, gases, CO₂, DP, airflow, temp/RH | Cleanrooms, offices, plants, ambient/perimeter | Spot, periodic, continuous fixed; personal/area | Indoor quality, emissions/impact, ventilation checks |
Water | pH, turbidity, DO, temp, conductivity, flow | Outfalls, streams, wells, process lines | Grab, composite (autosampler), continuous sensors | Discharge control, remediation, compliance records |
Noise & Vibration | SPL/LAeq, dose/TWA, octave bands, PPV | Workplaces, construction, transport, plants | Dosimetry, SLM surveys, long-term stations | Exposure control, impact mitigation, scheduling |
Microclimate & Met | WBGT, temp, RH, wind, radiation | Outdoor sites, warehouses, data halls, utilities | Portable checks, wearables, fixed stations | Heat stress control, uptime planning, task timing |
Special Hazards & Hygiene | Microbial/viable counts (CFU), ATP/endotoxin, Legionella; radiation/EMF (µSv/h, field strength); soil/waste (metals, organics, pH, moisture); leak/spill indicators (hydrocarbons, VOCs); building water hygiene (temperature, disinfectant residual) | Cleanrooms and healthcare; energy facilities and hospitals (radiation); utilities, brownfields, remediation sites (soil/waste); pipelines/tanks/sumps (leaks); cooling towers and complex plumbing (water hygiene) | Bioaerosol samplers and culture/rapid assays; Geiger/ion chambers and dosimeters; grab/composite soil & waste sampling with field analyzers; fixed leak sensors and tracer tests; periodic/continuous building water sampling based on risk | When specialized hazards or program requirements exceed standard air/water/noise/microclimate scopes, or where consequences are high and documentation must be highly defensible |
Keep reading for more information about one of these types.
1. Air Monitoring
Contexts: Ambient and indoor/IAQ/cleanroom
- What it measures: Particulate matter (PM1/PM2.5/PM10), total/respirable dust, gases (e.g., VOCs, CO₂ as a ventilation indicator), differential pressure (DP), airflow, temperature/RH.
- Where it’s used: Cleanrooms and labs; offices, schools, and healthcare; industrial plants; community/ambient networks; perimeter monitoring.
- Methods: Spot surveys (handheld), periodic sampling (short-term), continuous fixed networks with alerts; personal vs. area strategies.
- Decisions triggered: Ventilation tweaks, source controls, process enclosures, filtration upgrades, temporary work controls, notifications.
2. Water Monitoring
Contexts: Surface, groundwater, discharge/process
- What it measures: pH, turbidity, dissolved oxygen, temperature, conductivity, nutrients, metals; flow and volumetric sampling for discharge.
- Where it’s used: Outfalls and process water, remediation and construction dewatering, stormwater basins, rivers/streams, wells.
- Methods: Grab samples, composite samples (autosamplers), continuous sensors/loggers; fixed vs. mobile campaigns.
- Decisions triggered: Treatment adjustments, discharge holds, containment or diversion, corrective actions, reporting.
3. Noise & Vibration Monitoring
Contexts: Occupational and environmental
- What it measures: SPL/LAeq, dose/TWA, octave bands; peak particle velocity (PPV) and acceleration for vibration.
- Where it’s used: Workplaces and construction sites, transportation corridors, community impact studies, plants/utilities.
- Methods: Personal dosimetry, sound level meters (area), long-term stations with logging and alerts.
- Decisions triggered: Work/rest changes, PPE and engineering controls, scheduling windows, barrier placement, stakeholder communications.
4. Microclimate & Meteorology
Focus: Heat stress/WBGT and weather
- What it measures: WBGT, temperature, relative humidity, wind speed/direction, solar/radiant load (globe temperature), barometric pressure.
- Where it’s used: Outdoor worksites, warehouses and data halls, campuses, construction, utilities, agricultural/industrial yards.
- Methods: Portable spot checks and personal wearables; fixed stations feeding dashboards and alerts.
- Decisions triggered: Work/rest and hydration guidance, equipment derating, shutdown/startup criteria, event and task scheduling.
5. Special Hazards & Hygiene Monitoring
- What it measures: microbial/viable counts (CFU), ATP/endotoxin, Legionella; radiation/EMF (dose rate, field strength); soil/waste parameters (metals, organics, pH, moisture); leak indicators (hydrocarbons, VOCs); building water hygiene (temperature, disinfectant residual).
- Where it’s used: Pharmaceutical cleanrooms and healthcare; energy facilities and hospitals (radiation); utilities, brownfields, and remediation sites (soil/waste); pipelines, tanks, and sumps (leaks); facilities with cooling towers or complex plumbing (water hygiene).
- Methods: Bioaerosol samplers and culture/rapid assays; Geiger/ion chambers and dosimeters; grab/composite soil and waste sampling with field analyzers; fixed leak sensors and tracer tests; building water sampling and periodic/continuous strategies based on risk.
- Decisions triggered: Sanitation or process holds, isolation and remediation steps, waste handling/disposal actions, shutdown/startup criteria, maintenance tickets, and stakeholder notifications with documented corrective/preventive actions.
Workplace Regulations and Compliance
Environmental monitoring isn’t just good practice—it underpins compliance for worker protection and community stewardship.
In this section, we summarize commonly referenced frameworks for occupational exposure (e.g., silica and noise), ambient air quality (PM standards), water discharges (NPDES), and heat stress screening, along with documentation and QA/QC expectations.
Key Thresholds at a Glance
Type of EM | Standard | Pollutant / Metric | Limit | Averaging Period | Authority / Reference |
---|---|---|---|---|---|
Air | OSHA PEL | Respirable crystalline silica | 50 µg/m³ | 8-hour TWA | OSHA 1910.1053 • eCFR |
Air | OSHA Action Level | Respirable crystalline silica | 25 µg/m³ | 8-hour TWA | OSHA 1910.1053 • eCFR |
Noise & Vibration | OSHA Noise PEL | Sound level (A-weighted) | 90 dBA | 8-hour TWA | OSHA 1910.95 • eCFR |
Noise & Vibration | OSHA Noise Action Level | Sound level (A-weighted) | 85 dBA (hearing conservation trigger) | 8-hour TWA | OSHA 1910.95 • eCFR |
Air | EPA NAAQS | PM2.5 (primary, annual) | 9.0 µg/m³ | Annual mean (3-year avg) | EPA NAAQS Table • PM NAAQS Overview |
Air | EPA NAAQS | PM2.5 (24-hour) | 35 µg/m³ | 24-hour (98th %, 3-year avg) | EPA NAAQS Table |
Air | EPA NAAQS | PM10 (24-hour) | 150 µg/m³ | 24-hour | EPA NAAQS Table |
Water | NPDES (permit-specific) | Discharge limits (e.g., pH, TSS, turbidity) | As specified by permit | As specified by permit | About NPDES |
Microclimate & Meteorology | Heat stress (screening) | WBGT index | Task- and clothing-adjusted thresholds | Shift exposure | ISO 7243 |
OSHA and Occupational Exposure Limits
For respirable crystalline silica, OSHA sets a permissible exposure limit (PEL) of 50 µg/m³ (8-hour TWA) and an action level of 25 µg/m³ that triggers exposure assessment and controls.
→ See OSHA 1910.1053 (silica) and eCFR text.
Noise programs require hearing conservation at an 85 dBA action level and a 90 dBA PEL (8-hour TWA), with exposure-based controls and recordkeeping.
→ See OSHA 1910.95 and the eCFR text.
EPA Ambient Air Standards (Emissions/Community)
Ambient particulate matter is regulated under the National Ambient Air Quality Standards (NAAQS). The annual primary PM2.5 standard is 9.0 µg/m³, with a 24-hour PM2.5 value of 35 µg/m³ and a 24-hour PM10 value of 150 µg/m³; continuous stations are commonly used to manage operations between reference-method samples.
→ See the EPA NAAQS Table and the PM NAAQS overview.
Water Discharge Permitting (NPDES)
Point-source discharges are regulated through permit-specific limits under the National Pollutant Discharge Elimination System (NPDES). Programs typically combine grab/composite sampling with flow and field parameters to demonstrate compliance, supported by defensible chain-of-custody and reporting.
→ See About NPDES.
Heat Stress and Microclimate References
Many organizations screen hot environments using the WBGT index with adjustments for metabolic rate and clothing per ISO 7243. Monitoring supports work/rest guidance, hydration planning, and documentation during high-heat operations.
→ See ISO 7243.
Environmental Monitoring Tools
Environmental monitoring tools are the instruments you use to measure conditions: handheld meters, wearables, samplers, standalone loggers, and fixed area monitors.
Selection hinges on the parameter, where the measurement is taken, and how often you need data.
This chart contains the most commonly used tools for EM:
Category | Typical Use | Strengths | Limitations |
---|---|---|---|
Handheld meters | Spot checks, troubleshooting | Portable, immediate, versatile | No continuous trend; operator variability |
Wearables/personal sensors | Exposure measurement over shifts | True personal data, task-level insight | Deployment logistics, charging, consent |
Area monitors/fixed instruments | Continuous monitoring and alerts | Always-on visibility, audit-ready trends | Requires siting, power, networking |
Samplers (grab/composite) | Lab analysis and compliance records | High defensibility, method standardization | Delayed results, handling/chain-of-custody |
Data loggers & DAQ | Trend studies, method development | Simple, flexible integration | Manual retrieval unless networked |
Mobile platforms | Mapping plumes, rapid coverage | High spatial resolution, agility | Motion effects, power/weight tradeoffs |
Keep reading for more information about each category of environmental monitoring tool.
Handheld Meters (Spot Surveys)
These are your fastest path from question to answer—ideal for triage and quick verification. Use them to confirm a hypothesis before committing to longer-term monitoring.
- What: direct-read measurements for air, noise, heat, differential pressure, and basic gases.
- Where: indoor investigations, cleanroom checks, maintenance rounds, perimeter walk-throughs.
- When to use: quick diagnostics, baselining, complaint response, verification of controls.
- Pros/limits: portable, immediate results; limited trend visibility and operator-dependent.
Wearables & Personal Sensors (Exposure)
These capture the worker’s true breathing-zone or personal exposure over time. They transform task-level risk into actionable insights for controls and training.
- What: personal exposure to noise, heat stress, dust, and selected gases.
- Where: worker-borne monitoring across shifts and tasks.
- When to use: compliance programs, job task profiling, work/rest guidance.
- Pros/limits: true exposure data; requires deployment logistics and battery/charging plans.
Area Monitors & Fixed Instruments (Continuous)
These provide 24/7 situational awareness with alarms, trends, and audit-ready history. Siting and connectivity matter—place them where risk and decisions intersect.
- What: continuous readings for particulates, gases, noise, microclimate, and ventilation.
- Where: data halls, cleanrooms, production lines, construction perimeters, communities.
- When to use: real-time alerts, long-term trends, audit trails.
- Pros/limits: always-on visibility; needs power, siting, and connectivity.
Samplers (Grab & Composite)
Use these when lab-grade defensibility or permit language requires method-defined samples. They pair well with continuous sensors to manage operations between lab results.
- What: integrated samples for water (pH, turbidity, conductivity, DO), and select air methods.
- Where: discharge points, stormwater, remediation sites, process lines.
- When to use: lab-grade analysis, compliance documentation, source attribution.
- Pros/limits: high accuracy and defensibility; delayed results and handling burden.
Data Loggers & DAQ
Think of these as simple recorders or integration hubs that bridge tools and systems. They’re ideal for method development, redundancy, or trending without a full network.
- What: standalone recorders or multi-channel acquisition for sensors (temp/RH, pressure, vibration, etc.).
- Where: equipment bays, warehouses, remote enclosures, pilot studies.
- When to use: trending without constant connectivity, method development, redundancy.
- Pros/limits: simple and flexible; manual data retrieval unless networked.
Mobile Platforms (Carts, Vehicles, UAVs as Carriers)
Mobile carriers turn static instruments into mapping tools, revealing spatial patterns and plumes. Plan routes and apply motion QA to keep data reliable.
- What: moving platforms hosting meters, pumps, or sensor arrays.
- Where: large facilities, corridors, outdoor perimeters, difficult-to-access zones.
- When to use: mapping plumes/gradients, rapid coverage, hot-spot hunting.
- Pros/limits: broad spatial coverage; motion and power constraints to manage.
Environmental Monitoring Systems
Environmental monitoring systems are end-to-end platforms that connect many tools and sensors, collect and validate their data, and turn it into alerts, dashboards, and records.
How EM systems are different from EM tools:
- EM tools take measurements.
- EM systems orchestrate networks, data flows, notifications, and governance at scale.
This chart contains an overview of EM systems:
Architecture | Typical Use | Strengths | Tradeoffs |
---|---|---|---|
Fixed LAN/Wi-Fi | Cleanrooms, data centers, production areas | Low latency, high throughput, stable power | Cabling and IT coordination required |
Cellular Backhaul | Remote sites, temporary projects, perimeters | Quick to deploy, independent of site IT | Recurring data plans, variable signal quality |
LPWAN/Mesh | Campus-wide and long-range sensor fleets | Long battery life, wide coverage | Lower bandwidth, planning for gateways |
Hybrid Edge + Cloud | Sites needing local buffering and fleet analytics | Resilience, scale, centralized management | More components and governance to maintain |
Portable Trailers/Carts | Construction, events, incident response | Rapid deployment, repositionable coverage | Logistics, power and security considerations |
Standalone Loggers with Sync | Air-gapped or low-bandwidth environments | Simple, robust, minimal networking | No real-time alerts until upload |
Keep reading for more information about the different EM system elements covered in the chart.
Core Components
These are the building blocks that turn individual sensors into a dependable platform. Favor modular pieces you can service, validate, and audit without taking the whole system down.
- Sensors and devices: air, water, noise, vibration, microclimate, differential pressure, and more.
- Gateways and edge nodes: protocol translation, buffering, local rules, and failover logic.
- Power: mains, PoE, battery, solar; backup strategies and runtime targets.
- Communications: Ethernet, Wi-Fi, cellular, LPWAN/mesh (e.g., LoRaWAN concepts), industrial buses.
- Data platform: edge and/or cloud storage, validation, normalization, retention policies.
- Dashboards and alerting: role-based views, thresholds, status, and trend analytics.
- Device management: provisioning, firmware, calibration tracking, inventory.
- Access control: users, roles, audit logs, change history.
Common Architectures
Choose a topology that fits risk, distance, and IT constraints. Aim for the lightest design that still meets latency, power, and coverage requirements.
- Fixed LAN/Wi-Fi: high-throughput sites (cleanrooms, data halls) with stable power and cabling.
- Cellular backhaul: remote or temporary locations where wired networks aren’t practical.
- LPWAN/Mesh: long-range, low-power sensor networks for campuses and perimeters.
- Hybrid edge + cloud: local buffering/rules with cloud analytics and fleet management.
- Portable trailers/carts: rapid-deploy stations for construction, events, or incident response.
- Standalone loggers with sync: periodic uploads for low-bandwidth or air-gapped environments.
Alerting, Reporting, and Governance
This is where data becomes action and evidence. Define thresholds, roles, and escalation paths so alerts lead to timely, documented responses.
- Thresholds and rules: static limits, rate-of-change, time-weighting, and hysteresis/debounce.
- Escalations: multi-stage notifications, duty schedules, maintenance windows, acknowledgements.
- Data quality: calibration intervals, drift checks, data validation, gap/backfill handling.
- Records: dashboards, exports, automated reports, audit trails, tamper-evident logs.
- Retention: rollups, cold storage, and documented lifecycle policies.
Integrations and Interoperability
Systems create outsized value when they connect to the tools your teams already use. Prefer open interfaces and standards to avoid vendor lock-in.
- APIs/webhooks, CSV/FTP drops, and industrial protocols (OPC UA/Modbus concepts).
- Facility systems: EMS/BMS, DCIM, and leak/differential pressure into site views.
- Operations: CMMS/SCADA, ticketing/ITSM for work orders and incident handling.
- Analytics: BI tools and data warehouses for trend analysis and forecasting.
Checklist—When an EM System Is Warranted
8 Industries that Use Environmental Monitoring Every Day
Environmental monitoring shows up differently from industry to industry, but the goals are remarkably similar: protect people, safeguard quality, and stay compliant.
What changes are the dominant risks, where sensors live (people, process, or perimeter), and how quickly decisions need to be made.
What stays the same is the backbone—clear objectives, fit-for-purpose measurements, reliable alerts, and defensible records.
Here are eight sectors that rely on environmental monitoring to keep people, products, and operations safe.

1. Pharmaceutical Environmental Monitoring
Product integrity depends on tightly controlled environments. Particles, differential pressure, temperature/RH, and airflow are watched continuously at critical points; spot checks and sampling add context.
Environmental monitoring in pharmaceutical & cleanrooms includes:
- Continuous particle, DP, and temp/RH tracking at critical zones with alerting
- Handheld verification and smoke studies to confirm airflow and room recovery
- Targeted viable/nonviable sampling during manufacturing and changeovers
- Investigation workflows to review trends, isolate causes, and adjust HVAC/HEPA
2. Data Center Environmental Monitoring
Uptime and efficiency hinge on microclimate control and early leak detection. Fixed sensors trend temp/RH/DP and airflow; portable tools support commissioning and troubleshooting.
Environmental monitoring in data centers includes:
- Continuous temp/RH/DP and airflow mapping across hot and cold aisles
- Leak detection underfloor and in racks with escalation to facility systems
- Event correlation between IT loads, fan speeds, and setpoint changes
- Alert logic to prevent thermal excursions and trigger workload balancing
3. Business Environment Environmental Monitoring (Offices/Warehouses/Retail)
Comfort and indoor air quality affect health and productivity. Surveys validate ventilation; select areas run on continuous IAQ monitors for trend visibility.
Environmental monitoring in business environments includes:
- CO₂, temp/RH, PM, VOCs, and noise checks in high-occupancy and complaint areas
- Periodic IAQ surveys to verify ventilation and filtration performance
- Continuous monitoring in representative zones for baselines and alerts
- Operational changes such as ventilation rate adjustments and source control
4. Manufacturing Environmental Monitoring
Worker protection and process quality drive multi-parameter monitoring. Programs couple personal exposure measurements with area and perimeter instruments.
Environmental monitoring in manufacturing includes:
- Personal noise/dust/gas exposure tracking for high-risk tasks and shifts
- Area monitors near sources, process bays, and collection points
- Perimeter stations to quantify off-site impact and support complaints response
- Maintenance validation after enclosure, filtration, or ventilation changes
5. Construction & Mining Environmental Monitoring
Activities create short, intense exposure and community impacts. Mobile deployments pair task-based measurements with perimeter and meteorology.
Environmental monitoring in construction & mining includes:
- Task-based exposure checks during cutting, drilling, blasting, and crushing
- Perimeter networks for PM, noise, and vibration with wind correlation
- Real-time alarms to trigger suppression, tool changes, or schedule shifts
- Documentation for compliance and project communications
6. Energy & Utilities Environmental Monitoring
Reliability and environmental stewardship require leak, emissions, and microclimate visibility across distributed assets.
Environmental monitoring in energy & utilities includes:
- Gas and VOC detection near process units, substations, and pipelines
- Weather, noise/vibration, and water quality near intakes/outfalls
- Fixed networks with remote communications for unmanned sites
- Escalations to isolate leaks, adjust load, or dispatch field crews
7. Waste/Remediation & Landfill Environmental Monitoring
Odors, emissions, and leachate need continuous attention to protect nearby communities and verify mitigation.
Environmental monitoring in waste/remediation & landfills includes:
- Methane/VOC and H₂S/odor tracking at active cells and perimeters
- PM monitoring on unpaved routes and tipping floors with wind context
- Water quality and flow checks at leachate and monitoring wells
- Effectiveness verification for covers, misting, surfactants, and traffic routing
8. Municipal & Community Program Environmental Monitoring
Distributed networks provide neighborhood-level insight and transparency for planning and public health.
Environmental monitoring in municipal/ambient & community programs includes:
- Ambient PM and gas sensors across representative neighborhoods and corridors
- Meteorology co-location for dispersion and source attribution context
- Noise stations near transport and other high-impact sources
- Public summaries and advisories supported by validated, audit-ready data
AI for Environmental Monitoring
Artificial intelligence augments rule-based monitoring by spotting patterns, forecasting risk, and reducing nuisance alarms.
It works best alongside clear thresholds, calibration routines, and documented QA/QC—not as a replacement.
The table below summarizes common AI use cases, what data they need, typical model families, expected outcomes, and caveats to watch.
Use Case | Data Needed | Typical Model | Outcome | Caveats |
---|---|---|---|---|
Anomaly detection | High-cadence time series, calibration logs | Control charts, isolation/autoencoder, change-point | Earlier incident detection with fewer false alarms | Sensitive to sensor drift and gaps without QA flags |
Forecasting exceedance risk | Signals + met/activity context, labeled events | ARIMA/ETS, boosted trees, temporal nets (when justified) | Proactive controls and scheduling to avoid excursions | Regime changes can break models; retraining needed |
Drift detection & auto-QA/QC | Reference comparisons, maintenance metadata | CUSUM, residual monitoring, Bayesian change detection | Fewer bad alerts; timely calibration or sensor service | Requires reliable references or multi-sensor checks |
Data fusion & gap-filling | Multiple sensors, met, activity logs, topology | Kalman/state-space, kNN/regression, graph methods | More resilient trends; continuous dashboards | Document imputation; limit use for compliance metrics |
Source attribution hints | Sensor arrays + wind/activity/operations data | Correlation/lag analysis, clustering, hybrid physics | Faster root-cause hypotheses and targeted mitigation | Directional certainty varies; validate before action |
Six Core Use Cases for AI
AI adds value where rules alone miss context or subtle patterns. Start with narrowly defined decisions and expand as data quality and user trust grow.
Here are six of the top ways to use AI for environmental monitoring:
1. Anomaly detection
Flag unexpected shifts in PM, gases, noise, temperature/RH, or differential pressure.
2. Trend and forecasting
Short-term predictions of exceedance risk for proactive controls or scheduling.
3. Drift detection and auto-QA/QC
Identify sensor drift, fouling, or step changes; trigger verification workflows.
4. Data fusion and gap-filling
Combine multiple sensors (e.g., dust + met) and safely impute brief outages.
5. Source attribution hints
Correlate signals with wind/activity logs to prioritize mitigation.
6. Predictive alerts
Escalate when patterns historically precede incidents or quality excursions.
Data Requirements
Good models are built on good data.
Establish cadence, calibration, and context before tuning algorithms so outputs are trustworthy and auditable.
Here’s what to consider when it comes to data:
- Coverage and cadence. Adequate sampling rate for the phenomenon (seconds–minutes for air/noise; minutes–hours for water/process).
- Calibration and metadata. Timestamps, units, location, sensor IDs, maintenance logs, and calibration history.
- Labels/ground truth. Tagged events (exceedances, complaints, batch failures) for training and evaluation.
- Quality checks. Validation rules, outlier handling, gap flags, and reference comparisons where available.
- Privacy and retention. Policies for personal exposure data and community programs; secure storage and access control.
Model Approaches
Pick the simplest approach that meets the objective and can be explained to stakeholders. Use advanced methods when they materially improve accuracy or reduce false alarms.
Here are different models to consider when using AI for environmental monitoring:
- Classical baselines. Moving averages, seasonality decomposition, control charts.
- Time-series ML. ARIMA/ETS, gradient boosting on features, recurrent/temporal models where justified.
- Anomaly and change-point detection. Density-based, isolation, Bayesian, or kernel methods.
- Supervised vs. unsupervised. Labeled exceedance prediction vs. pattern discovery in unlabeled streams.
- Physics-informed and hybrid. Blend dispersion/heat models with data-driven corrections.
Checklist—AI for EM Implementation
Treat AI like any other operational control—define actions first, then automate. Make sure to pilot, measure, and iterate with users before scaling across sites.
Here’s your implementation checklist:
Environmental Monitoring Jobs
Environmental monitoring careers span EHS and industrial hygiene, cleanroom quality, facilities and data center operations, construction and mining, energy/utilities, consulting, and the public sector.
Roles blend hands-on fieldwork with data review, alerts triage, and defensible reporting that supports safety, quality, uptime, and community outcomes.
Here’s a snapshot of what a day of working in environmental monitoring might look like:
Day in the Life
- Morning: check dashboards, clear overnight alerts, verify calibrations, plan rounds.
- Mid-day: conduct surveys and sampling; adjust siting; log field notes and photos.
- Afternoon: validate data, investigate anomalies, issue work orders, update tickets.
- End of day: compile trend snapshots, write a brief report, and set next-day thresholds or tasks.
And here’s a table summarizing common EM jobs:
Role | Typical Responsibilities | Key Skills | Industries |
---|---|---|---|
Monitoring Technician | Rounds, setup, calibration checks, sampling, basic reports | Siting, QA/QC, instrument care, documentation | Industrial, construction, utilities, public sector |
IH/EHS Specialist | Exposure assessments, risk controls, alert response, training | Exposure math, controls, communication, incident review | Manufacturing, construction, energy, logistics |
Cleanroom EM Specialist | FMS oversight, particles/DP/temp-RH trending, excursion CAPA | Aseptic practices, airflow, data integrity, deviation writing | Pharma, biotech, med device |
Data Center Tech | Temp/RH/DP mapping, leak checks, alert escalations, tickets | Microclimate, airflow, DCIM/BMS basics, uptime mindset | Data centers, enterprise facilities |
Environmental Scientist/Consultant | Program design, studies, modeling context, stakeholder reports | Sampling plans, analytics, visualization, client comms | Public sector, ambient programs, industry clients |
EMS Systems Administrator | Device onboarding, alert rules, integrations, audits, retention | Networking, APIs, security, change control, QA/QC automation | Pharma, data centers, utilities, industrial fleets |
Keep reading to learn more about common environmental monitoring jobs, the skills you need to do them, and more related to working in EM.
Common Roles
Titles vary by industry, but the core mission is consistent: collect reliable measurements and turn them into timely actions. Teams range from field technicians to systems administrators who keep networks, data flows, and alert logic running smoothly.
- Environmental Monitoring Technician/Technologist
- EHS/Industrial Hygiene Specialist
- Cleanroom/Pharma Environmental Monitoring Specialist
- Data Center Environmental Technician
- Environmental Scientist/Consultant
- Systems Administrator for EM/EMS Platforms
Core Skills
Strong measurement fundamentals pair with clear thinking about siting, cadence, and QA/QC. Data literacy and crisp communication turn raw readings into decisions others can trust.
- Measurement methods for air, water, noise/vibration, and microclimate; siting strategy.
- QA/QC fundamentals: calibration traceability, validation checks, defensible records.
- Data literacy: basic statistics, time-series trending, charting, and outlier review.
- Scripting/BI familiarity (e.g., spreadsheets, simple SQL or Python, or BI dashboards).
- Risk communication: concise, action-oriented summaries for technical and non-technical audiences.
- Safety practices: PPE, hazard recognition, permits, confined spaces, and job hazard analysis.
Tools and Systems You’ll Use
Expect a blend of handhelds, wearables, area monitors, and samplers feeding loggers or networked platforms. Dashboards and alerting workflows connect the field to operations and maintenance.
- Handheld meters, wearables/personal sensors, area monitors, samplers, and data loggers/DAQ.
- Dashboards and analytics for trends, QA/QC flags, and report generation.
- Alerting/escalation workflows with duty schedules and maintenance windows.
- Facility and operations touchpoints: BMS/DCIM/SCADA concepts, CMMS/ITSM tickets, and BI tools.
Credentials & Training
Many paths lead into EM, from technician programs to science or engineering degrees. Short courses and on-the-job training in calibration, QA/QC, and documentation accelerate readiness.
- Degree fields: environmental science/engineering, occupational hygiene, chemistry, facilities/ME, or related technician programs.
- Short courses: sampling methods, calibration basics, QA/QC, data analysis, and documentation.
- Domain familiarity: cleanroom/GMP concepts, data hall microclimate, construction/mining exposure control.
- Skills boosters: GIS basics, SQL/Excel/Python fundamentals, technical writing and visualization.
- Safety cards and permits relevant to sites worked.
Career Paths
Progression can be technical, managerial, or systems/data-focused. Cross-specializing by medium or industry broadens opportunities and resilience across market cycles.
- Individual contributor → senior/lead → program owner or manager.
- Cross-specialize by medium (air, water, noise/vibration) or by industry (pharma, data centers, utilities).
- Move into systems and data: EMS administration, integrations, analytics, and reliability engineering.
- Consulting track: multi-site program design, audits, and incident investigations.
Environmental Monitoring FAQ
Here are answers to commonly asked questions about environmental monitoring.
What is environmental monitoring?
Environmental monitoring is the ongoing measurement of environmental conditions—such as air, water, noise, and microclimate—to understand risk and guide decisions. It turns raw readings into actions that protect people, products, and operations.
Why is environmental monitoring important?
It reduces incidents, speeds response to exceedances, and provides defensible records. Programs also improve quality, uptime, and community outcomes while helping teams manage costs.
What are the tools used in environmental monitoring?
Common tools include handheld meters, wearables/personal sensors, area monitors and fixed instruments, samplers (grab/composite), and data loggers/DAQ. Mobile platforms can carry sensors for mapping.
What are the four types of environmental monitoring?
Air, water, noise and vibration, and microclimate/meteorology. Many programs blend multiple types—for example, dust + noise + weather on construction sites.
What is the difference between environmental monitoring tools and environmental monitoring systems?
Tools (devices) capture measurements in the field. Systems connect many tools, manage data and alerts, provide dashboards and reporting, and integrate with other software.
How do I choose which parameters to monitor?
Start with your risks, processes, and stakeholders, then map parameters that indicate those risks. Consider regulatory or internal limits, decision triggers, and the feasibility of accurate, reliable measurement.
What is the difference between spot, periodic, and continuous monitoring?
Spot checks provide quick snapshots, periodic monitoring follows a schedule (e.g., daily/weekly routes), and continuous monitoring measures 24/7 with alerts and trend history. Choose based on how fast conditions change and how quickly you must act.
How often should instruments be calibrated or validated?
Follow manufacturer guidance and your QA/QC plan, adjusting for criticality, drift behavior, and operating conditions. Many programs combine scheduled calibration with interim checks and post-event verification.
What does QA/QC mean in environmental monitoring?
QA/QC covers procedures that ensure data are fit for purpose, including calibration, verification, data validation, and documentation. Good QA/QC reduces false alarms and supports audits and investigations.
How do indoor programs differ from outdoor or ambient programs?
Indoor programs focus on microclimate, ventilation, and worker or product conditions with tighter spatial control. Outdoor programs emphasize perimeter or community impacts, meteorology, and source–receptor dynamics.
What is environmental monitoring in a business environment?
Offices, warehouses, and retail locations track CO₂, temperature/humidity, particulates, VOCs, and noise to verify ventilation, comfort, and productivity. Some spaces run continuous IAQ, while others use periodic surveys.
What is environmental monitoring in pharmaceutical or cleanroom settings?
These programs maintain controlled environments with continuous particle, differential pressure, and temperature/RH monitoring at critical points. Targeted viable/nonviable sampling and strict documentation support product quality.
What is data center environmental monitoring?
Data halls trend temperature, humidity, differential pressure, and airflow, often with leak detection and hot-spot checks. Alerts help prevent thermal excursions and support efficient operations.
Who is responsible for environmental monitoring on a site?
Responsibility is shared across environmental/EHS teams, quality or cleanroom staff, facilities or data center operations, and sometimes third-party consultants. A clear RACI and escalation plan keeps actions timely.
How do I start an environmental monitoring program from scratch?
Define objectives and decision thresholds, choose parameters and methods, and draft a siting and cadence plan. Pilot on a small scale, validate data with QA/QC, refine alert logic, and then scale with training and documentation.
What skills are useful for an environmental monitoring job?
Measurement methods and siting, calibration and QA/QC, basic data analysis and visualization, and concise communication are foundational. Familiarity with dashboards, alert workflows, and simple scripting or BI helps you advance.