Best Dust Monitors for Sale [New for 2026] + More Environmental Monitoring Solutions
Want to buy or rent a dust monitor? Or looking for other environmental monitoring tools?
Keep reading for the top options on the market.
[Related read: Environmental Monitoring Tools & Equipment: 2026 Buyer’s Guide]
Note: All solutions below support compliance with OSHA, EPA, and ISO air quality standards, and include rental or purchase options with expert calibration and technical support.
1. Bettair Air Quality Mapping System—Dust and Air Pollution Monitor
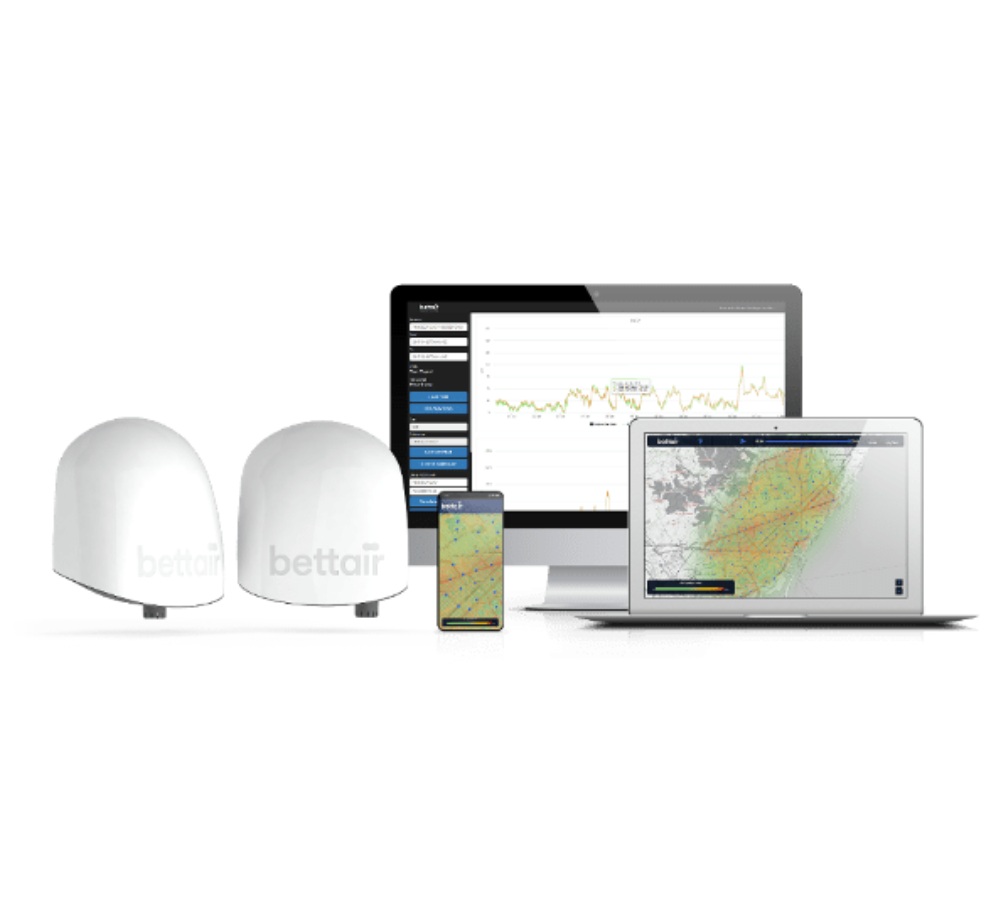
The Bettair Air Quality Mapping System provides advanced, high-resolution air quality data using a network of smart sensors that monitor particulate matter (PM1, PM2.5, PM10) and key gases such as NO₂, CO, and O₃.
Designed for cities, industrial zones, and environmental agencies, Bettair offers real-time mapping and analytics to identify pollution sources and trends across large areas.
- High-accuracy particulate monitoring. Tracks PM1, PM2.5, and PM10 concentrations with precision sensors.
- Smart network integration. Connects multiple units for continuous, georeferenced air quality mapping.
- Advanced analytics. Cloud platform provides data visualization, trend analysis, and compliance reporting.
- Low-maintenance design. Long-life sensors with remote calibration and automated diagnostics.
Buy or Rent the dnota Bettair Air Quality Mapping System.
Related Environmental Monitoring Tools
Here are some of the top environmental monitoring instruments for monitoring air flow, gases, and noise exposure in industrial and environmental applications.
2. TSI VelociCalc 9515—Air Velocity Meter
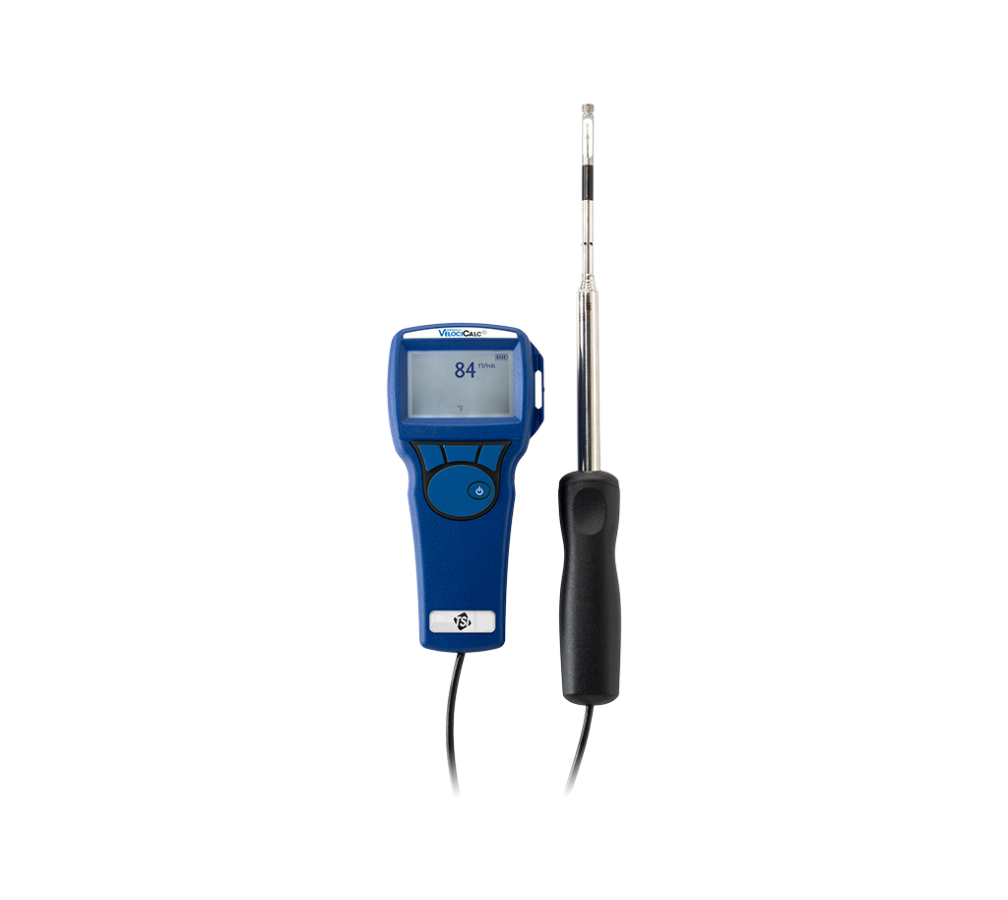
The TSI VelociCalc 9515 measures air velocity and temperature to verify ventilation performance and capture airflow data in dust-prone environments.
Its digital display and ergonomic probe make it ideal for HVAC testing, cleanroom certification, and process ventilation checks.
- Accurate airflow measurement. Measures air velocity from 0 to 4,000 fpm (20 m/s).
- Easy operation. Simple keypad navigation with real-time data display.
- Field durability. Rugged handheld design for use in industrial settings.
- Traceable calibration. NIST-certified accuracy for regulatory reporting.
Rent the TSI VelociCalc 9515 Air Velocity Meter.
3. RAE Systems MultiRAE Lite—Multi-Gas Detector

The MultiRAE Lite is a compact, portable gas detector capable of measuring up to six gases simultaneously.
It supports sensors for VOCs, O₂, CO, H₂S, and combustibles, making it a reliable tool for confined spaces, leak detection, and industrial air-quality monitoring.
- Versatile detection. Configurable for up to six gas sensors.
- Rugged portability. Designed for harsh industrial and field conditions.
- Smart safety alerts. Real-time audible and visual alarms for hazardous levels.
- Data logging. Integrated storage and PC connectivity for compliance records.
Buy or rent the RAE Systems MultiRAE Lite.
4. RAE Systems MiniRAE 3000 PID — VOC Monitor

The MiniRAE 3000 is a rugged photoionization detector (PID) for real-time VOC measurement across an exceptionally wide range.
It pairs well with dust monitoring by revealing gaseous co-contaminants during maintenance, turnarounds, or complaint investigations, and it’s built for harsh industrial environments.
- Broad measurement range. Detects VOCs from 0.1 to 15,000 ppm for survey and leak-tracking work.
- Fast response. Immediate readings to pinpoint sources and guide controls in the field.
- Industrial durability. Intrinsically safe design for refineries, chemical plants, and confined spaces.
- Data workflow. Onboard logging and download options to support incident documentation.
Buy or rent the RAE Systems MiniRAE 3000 PID.
5. Casella CEL-350IS—Intrinsically Safe Noise Dosimeter
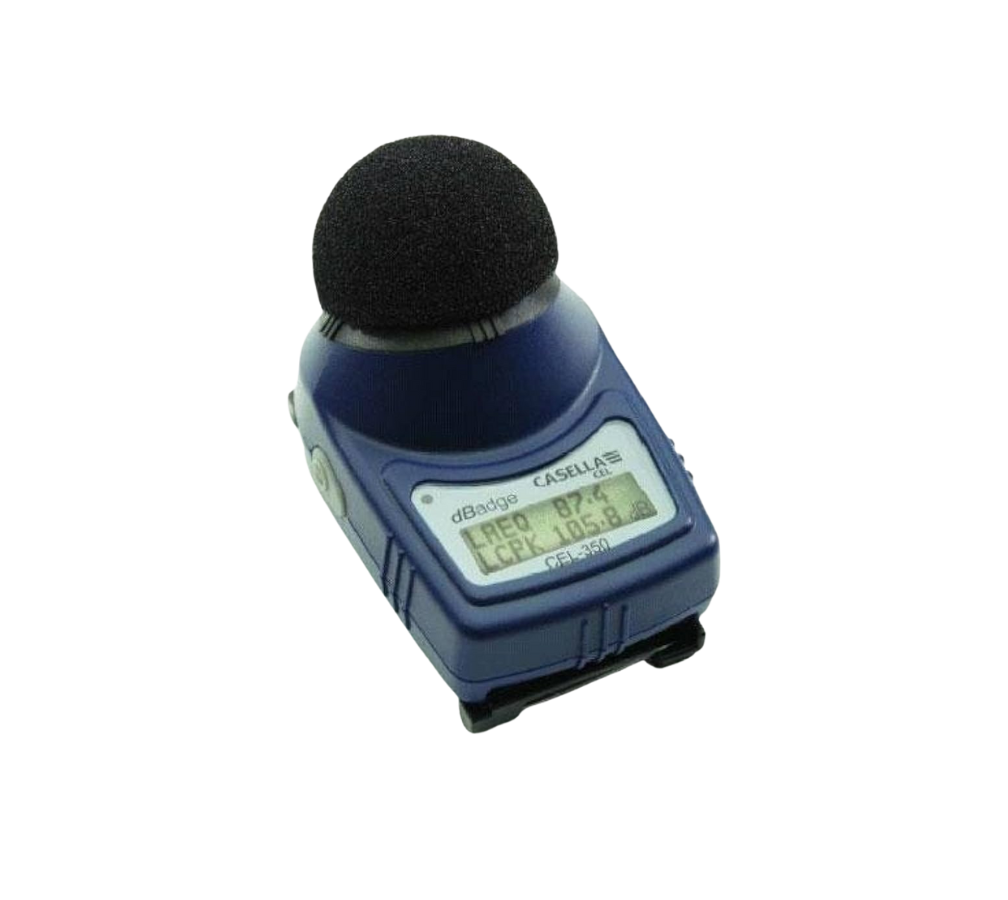
The Casella CEL-350IS is an intrinsically safe, wearable noise dosimeter for measuring personal noise exposure across a work shift.
It’s a valuable complement to dust and gas monitoring programs, helping maintain safe and compliant working environments.
- Intrinsically safe. Certified for use in oil & gas, chemical, and manufacturing plants.
- Personal exposure tracking. Records dose, TWA, and time-history data for full-shift analysis.
- Reliable accuracy. Auto-calibration ensures consistent, compliant performance.
- Compact design. Lightweight and comfortable for continuous wear.
How Dust Monitors Work
Understanding how dust monitors work helps ensure accurate readings and informed equipment choices.
These devices detect and quantify airborne particles using several key measurement methods, each suited to different environments and regulatory needs.
Below, we’ll look at the three most common types of dust monitoring equipment, and look at how each one measures the presence and levels of airborne particulates.

1. Light Scattering Dust Monitors
Light scattering dust monitors use photometric sensors to measure how particles scatter a beam of light as they pass through an optical chamber.
The intensity of scattered light correlates to the particle concentration in the air, making this method ideal for portable and personal dust monitors that need instant, real-time feedback.
Here’s a quick overview of how light scattering works:
- A light source (LED/laser) emits a beam into an optical chamber.
- Air is drawn through; particles intersect the beam and scatter light.
- A photodetector measures scattered intensity at set angles.
- The instrument converts the signal to particle concentration (e.g., PM2.5/PM10) using calibration factors.
2. Beta Attenuation Dust Monitors
Beta attenuation monitors (BAM) use a small radioactive source to measure how much beta radiation is absorbed by dust collected on a filter tape.
Because the mass of dust directly affects absorption, this method provides highly accurate, continuous measurements for environmental and regulatory monitoring stations.
Here’s a quick overview of how beta attenuation works:
- The instrument advances clean filter tape into the measurement position.
- A pump draws air through the tape, collecting particles on its surface.
- A beta source emits radiation through the loaded tape to a detector.
- The drop in beta counts is converted to mass on the tape and then to concentration (µg/m³).
3. Gravimetric Sampling Dust Monitors
Gravimetric dust monitors draw air through a filter to physically capture particles, which are later weighed in a lab.
Though not real-time, this reference method sets the calibration standard for most electronic dust monitoring devices.
Here’s a quick overview of how gravimetric sampling works:
- Pre-weighed filters are installed in a calibrated sampler at a controlled flow rate.
- Air is sampled for a defined period (e.g., full shift or 24 hours), depositing particles on the filter.
- Filters are conditioned (temperature/humidity) and post-weighed in the lab.
- Mass gain and sampled volume are used to calculate concentration for compliance and calibration.
Workplace Regulations and Compliance
Dust monitoring isn’t just an important safety practice. In many cases, it’s legally required to meet occupational and environmental rules. This section outlines the key frameworks for worker exposure (OSHA, NIOSH/ACGIH) and ambient air (EPA NAAQS), including limits, accepted methods, and documentation.Key Thresholds at a Glance
| Standard | Pollutant / Fraction | Limit | Averaging Period | Authority / Reference |
|---|---|---|---|---|
| OSHA PEL | Respirable Crystalline Silica | 50 µg/m³ | 8-hour TWA | 29 CFR 1910.1053 • 29 CFR 1926.1153 |
| OSHA Action Level | Respirable Crystalline Silica | 25 µg/m³ | 8-hour TWA | 29 CFR 1910.1053 |
| OSHA PEL (PNOR) | Particulates Not Otherwise Regulated — Total | 15 mg/m³ | 8-hour TWA | OSHA Table Z-1 |
| OSHA PEL (PNOR) | Particulates Not Otherwise Regulated — Respirable | 5 mg/m³ | 8-hour TWA | OSHA Table Z-3 |
| EPA NAAQS | PM2.5 (primary, annual) | 9.0 µg/m³ | Annual | EPA PM NAAQS • 2024 Final Rule (PDF) |
| EPA NAAQS | PM2.5 (24-hour) | 35 µg/m³ | 24-hour | EPA PM NAAQS |
| EPA NAAQS | PM10 (24-hour) | 150 µg/m³ | 24-hour | EPA PM NAAQS |

OSHA and NIOSH/ACGIH Exposure Limits
OSHA’s respirable crystalline silica standard establishes a PEL of 50 µg/m³ (8-hour TWA) and an action level of 25 µg/m³, triggering exposure assessment, engineering and work practice controls, medical surveillance, and record-keeping requirements for general industry and construction. → See 29 CFR 1910.1053 and 29 CFR 1926.1153. A practical rule of thumb: if initial monitoring shows or is reasonably expected to show exposures at or above the 25 µg/m³ action level, OSHA’s silica standard triggers ongoing exposure assessment and implementation of the hierarchy of controls:- Engineering controls first
- Then work practices, with respiratory protection as needed
EPA Ambient Air Standards (Emissions/Community)
For environmental (area) monitoring, the U.S. Environmental Protection Agency regulates ambient particulate concentrations under the National Ambient Air Quality Standards (NAAQS). In 2024, EPA tightened the annual primary PM2.5 standard to 9.0 µg/m³ to strengthen public health protection. Fixed or perimeter dust emissions monitors are commonly used to track PM10 and PM2.5 trends and demonstrate compliance around industrial sites and construction projects. → See the EPA PM NAAQS overview and the 2024 final rule summary (PDF). When reporting ambient data, distinguish between reference methods (FRM) and equivalent/continuous methods (FEM): FRM (gravimetric) sets the legal benchmark for compliance decisions, while FEM/continuous systems deliver near-real-time trends and alarms that help manage operations between FRM sampling intervals.ISO/EN Technical References
ISO 7708 defines health-related particle size fractions—inhalable, thoracic, and respirable—so sampling reflects the portion of particles that reach relevant regions of the respiratory tract. For ambient air, EN 12341 specifies the gravimetric reference method for PM10/PM2.5 (24-hour filter sampling with defined inlets and flow), often used to benchmark continuous instruments.Calibration, Data Integrity, and Audit Readiness
Remember, data drives compliance. Regulatory decisions rely on traceable, reproducible measurements.- Use calibrated instruments, document zero/span checks, and maintain time-stamped records with clear SOP references.
- For ambient programs, align with EN 12341 where applicable.
- For personal exposure, match ISO 7708 size fractions and the governing PEL/REL/TLV. See the Best Practices section for detailed QA/QC procedures and checklists.
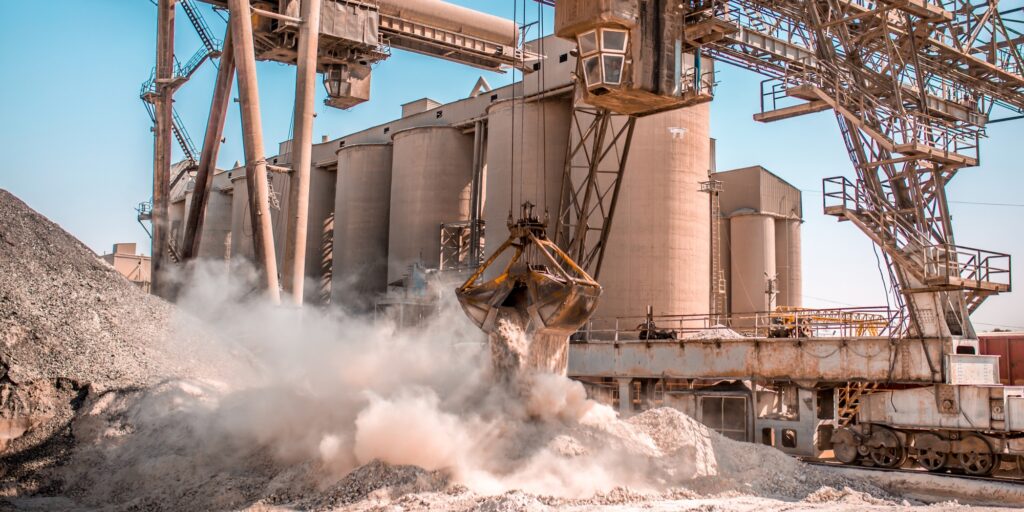
8 Industries that Rely on Dust Monitoring
Dust monitoring is essential across heavy industries to control worker exposure and manage emissions at the source and perimeter. Programs typically combine personal dust monitors for breathing-zone assessment with portable or fixed dust emissions monitors for fence-line and community protection. Here are 8 sectors that rely on dust monitoring to keep people safe.
1. Oil, Gas & Petrochemical
Turnarounds, tank cleaning, and catalyst handling can release fine PM alongside gases. Dust monitoring devices operate alongside VOC and toxic gas detection for a complete picture. Dust monitoring in oil and gas includes:- Task-based personal monitoring during abrasive blasting and cutting
- Area monitors near tank farms, flare areas, and loading racks
- Perimeter PM tracking during turnarounds and construction
- Integrated reviews with gas/VOC data for root-cause analysi
2. Mining & Quarrying
Crushing, screening, and haul roads generate persistent dust that affects workers and nearby communities. Operations blend personal dust monitoring devices with portable dust monitors for strategic hotspots and fence lines. Dust monitoring in mining includes:- Breathing-zone sampling for drillers, crusher attendants, and maintenance crews
- Roadside PM tracking on haul routes and loading areas
- Blasting event studies with meteorology correlation
- Continuous fence-line monitoring for compliance and complaints
3. Manufacturing & Metalworking
Grinding, polishing, foundry work, and thermal cutting produce mixed particle sizes, sometimes with metal fumes. Industrial dust monitoring equipment supports exposure assessment and process control. Dust monitoring in manufacturing includes:- Personal monitors for welders, grinders, and finishing lines
- Area monitors near cutting tables, baghouses, and collection points
- Time-history analysis to identify peak tasks and shift patterns
- Maintenance verification after filter changeouts or ventilation tuning
4. Construction & Demolition
Silica-generating activities like cutting, grinding, and drilling create short, intense exposure peaks that require close control. Sites also face perimeter dust complaints, so pairing personal monitoring with area stations is standard. Dust monitoring in construction includes:- Task-based exposure checks during concrete cutting, tuckpointing, and drywall sanding
- Perimeter monitoring for PM10/PM2.5 at active boundaries
- Real-time alarms to trigger wet methods or tool changes
- Validation of engineering controls and PPE effectiveness
5. Cement, Aggregates & Concrete
Material handling and bagging stations can elevate airborne particulates, while mills and kilns drive continuous emissions. Programs blend portable surveys with fixed stations. Dust monitoring in cement and aggregates includes:- Personal exposure checks for mill operators and bagging crews
- PM10/PM2.5 perimeter monitoring during high-throughput periods
- Source attribution using activity logs and wind data
- Post-maintenance validation of enclosures and local exhaust
6. Agriculture & Grain Handling
Organic and combustible dusts in silos, elevators, and mills require careful monitoring to prevent exposure and ignition hazards. Portable dust monitors support walk-through surveys and targeted controls. Dust monitoring in agriculture includes:- Breathing-zone sampling for elevator operators and cleaners
- Spot checks at transfer points, bagging, and milling operations
- Perimeter monitoring during harvest and loadout
- Housekeeping verification and ventilation optimization
7. Waste & Recycling / Landfills
Shredding, tipping floors, and unpaved traffic routes drive intermittent dust events and community complaints. Industrial dust monitoring equipment helps quantify trends and verify mitigation. Dust monitoring in waste and recycling includes:- Personal monitoring for picker lines and heavy-equipment operators
- Fence-line PM10/PM2.5 with alarms during high-wind periods
- Mobile surveys to locate sources across large sites
- Effectiveness checks for misting, surfactants, and road watering
8. Ports & Logistics (Bulk Materials)
Conveyor transfers, ship unloading, and stockpiles release fine particulates that vary with wind and activity cycles. Programs pair portable dust monitors with fixed fence-line stations. Dust monitoring in logistics includes:- Perimeter monitoring near berths and storage yards
- Real-time checks at conveyors, stackers, and reclaimers
- Shift-aligned personal monitoring for loaders and operators
- Operational triggers tied to wind direction and threshold exceedances
Choosing the Right Dust Monitor
Select a dust monitor based on your objective, environment, and documentation needs.- If the goal is monitoring worker exposure, prioritize wearable personal dust monitors.
- For site trends and community impact, use fixed or portable dust monitoring devices.
- Personal dust monitors capture breathing-zone exposure over a full shift or task window, reporting time-history, TWA, and peaks.
- Portable dust monitors support rapid walkthroughs, hotspot identification, commissioning of controls, and complaint response.
- Fixed dust emissions monitors provide continuous monitoring, tracking location-based concentrations at fence lines, work zones, and communities.
| Type | Objective | Duration / Mobility | Data Output | Calibration / QA | Typical Use Cases | Pairing & Sync Notes |
|---|---|---|---|---|---|---|
| Personal (Wearable) | Worker exposure (TWA, peaks) | Full shift or task; high mobility | Time-history, TWA, max events | Zero/span checks; reference verification | Silica tasks; PPE validation; controls checks | Combine with perimeter/fixed monitors when community impact is possible; sync time stamps, wind, and activity logs. |
| Portable / Spot | Hotspot diagnosis, surveys | Short runs; mobile between points | Real-time trends; spot logs | Routine checks before/after surveys | Walkthroughs; complaint response; commissioning | Use alongside personal or fixed systems to correlate sources; align time stamps, wind data, and activity notes. |
| Fixed / Continuous | Area/emissions trends; compliance | 24/7; stationary | Continuous logs; thresholds; alarms | Scheduled calibration; audit trail | Fence-line; community monitoring; baselines | Pair with personal wearables where worker exposure is a concern; synchronize meteorology and site activity logs. |
Selection Criteria Checklist
Use this checklist to identify the right dust monitoring solution for your work environment and compliance needs.