

Environmental monitoring systems (EMS) help companies see, understand, and act on changing conditions in real time.
These systems protect people, products, and assets by turning scattered environmental data into early warnings, compliance evidence, and operational insight—so teams can prevent incidents, reduce downtime, and make informed decisions with confidence.
Environmental monitoring systems do this important work by linking environmental monitoring tools and sensors to a centralized data platform, where readings are validated, visualized, and analyzed to trigger alerts, generate reports, and feed other operational systems.
A typical EMS includes:
- Sensors/endpoints that measure air quality, gases/VOCs, noise, heat/microclimate, weather, or water.
- Edge & communications (gateways, LoRaWAN, LTE/5G, Wi-Fi, or PoE) to move data securely and buffer during outages.
- Data platform for ingest, time-series storage, QA/QC, calibration tracking, and device health.
- Visualization & alerts with dashboards, thresholds, alarm logic, and workflows.
- Integrations to EHS, CMMS/ERP, GIS, and digital twins via APIs or webhooks.

Tools vs. Systems
An environmental monitoring tool is a single device—like a sound level meter, gas detector, or particulate sensor—used to measure a specific parameter at a specific place and time.
An environmental monitoring system, on the other hand, connects many of these tools into a network, automating data collection, validation, and alerts across locations.
[Lire aussi : Environmental Monitoring: An In-Depth Guide—New for 2026]
Tools capture the readings. Then the system turns those readings into actionable intelligence.
Common alternate terms for environmental monitoring systems include:
- Continuous environmental monitoring system
- Environmental data management system
- Environmental monitoring network
- Real-time environmental monitoring platform
- Environmental monitoring and alert system
In this guide, we’ll share examples of environmental monitoring systems, look at their architecture, answer commonly asked questions, and a lot more—you can use the menu to the right to jump to the section you’re most interested in, or keep reading for the entire guide.
Environmental Monitoring Systems in Practice
Want to understand how an EMS works? The best way to explain it is to look at an example. Here’s one in-depth example of how a continuous environmental monitoring system comes together in the real world, and how individual connected products fit inside that architecture. Note: The example below isn’t exhaustive. Also, it focuses on systems-first outcomes: reliable data, timely alarms, and audit-ready records.Example: Construction Perimeter & Site Operations (Full EMS)
 A contractor deploys a mixed network to protect workers and the community during a multi-month project.
Around the perimeter, distributed ambient nodes stream PM and gases into the platform for heatmaps, trends, and alerts.
At noise-sensitive boundaries, a Class 1 noise meter in an environmental kit serves as a fixed node, logging Leq and triggering time-window alarms.
For task-based gas risks, wireless four-gas instruments publish personal/area readings through a cellular gateway during hot work and confined-space activities.
The platform validates data (range/spike/flatline/drift), routes alarms with escalation, and auto-builds daily summaries for stakeholders.
When alarms occur, responders attach notes/photos and open CMMS work orders directly from the event, creating a defensible trail from detection to resolution.
Here are the parts of the system:
A contractor deploys a mixed network to protect workers and the community during a multi-month project.
Around the perimeter, distributed ambient nodes stream PM and gases into the platform for heatmaps, trends, and alerts.
At noise-sensitive boundaries, a Class 1 noise meter in an environmental kit serves as a fixed node, logging Leq and triggering time-window alarms.
For task-based gas risks, wireless four-gas instruments publish personal/area readings through a cellular gateway during hot work and confined-space activities.
The platform validates data (range/spike/flatline/drift), routes alarms with escalation, and auto-builds daily summaries for stakeholders.
When alarms occur, responders attach notes/photos and open CMMS work orders directly from the event, creating a defensible trail from detection to resolution.
Here are the parts of the system:
- Perimeter ambient air: dnota Bettair®’s Air Quality Mapping System provides networked PM/gas nodes for continuous trends, hotspots, and community reporting.
- Fixed noise node: Casella’s CEL-633.A1 Class 1 Sound Level Meter Kit (with telemetry enclosure) feeds real-time Leq and scheduled reports from sensitive boundaries.
- Mobile gas endpoints: Wireless four-gas instruments like the RAE Systems QRAE 3 (moniteur à quatre gaz) or the RAE Systems MultiRAE Plus publish alarms during task-based work, with on-device buffering and backfill.
- Platform: Dashboards, QA/QC, alarm workflows with escalation, calibration tracking, audit trails, and exports/integrations (EHS/CMMS/GIS).
Featured Environmental Monitoring Tools
Here’s more information about the products mentioned above.1. dnota Bettair®’s Air Quality Mapping System—Dust and air pollution monitor
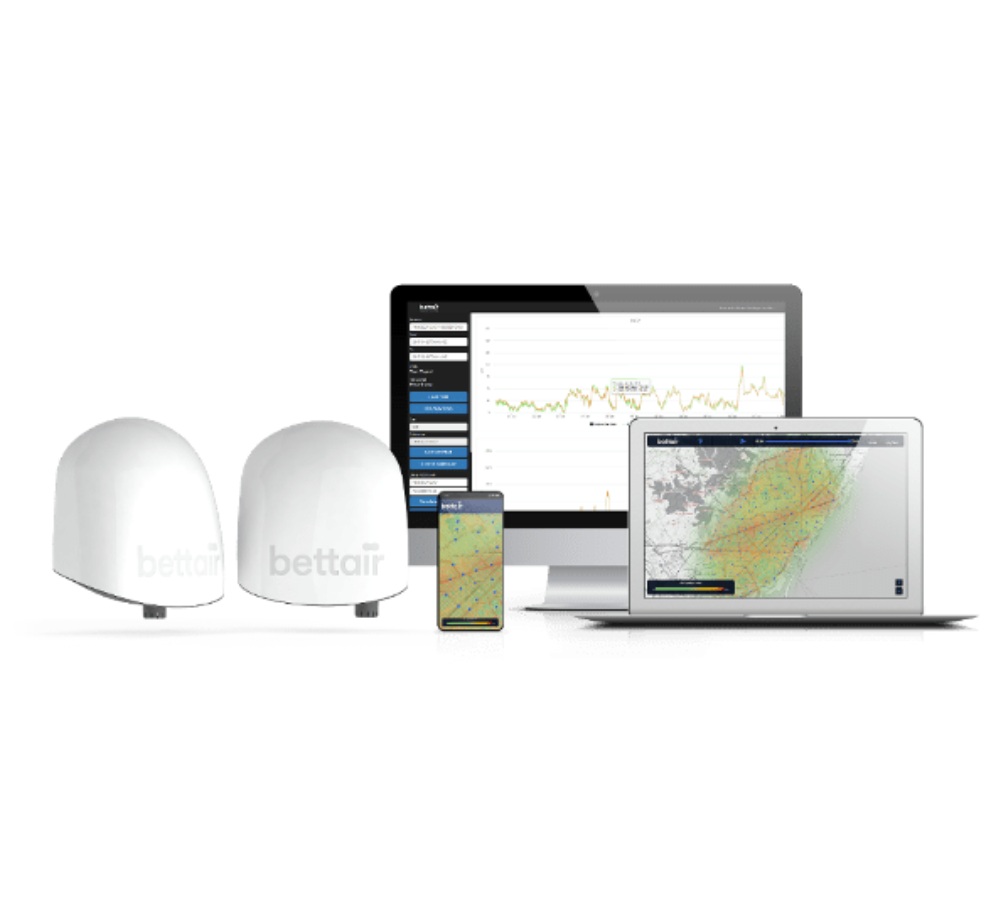
- Distributed nodes with georeferenced analytics
- Continuous trends, hotspots, and alerts
- Cloud dashboards with scheduled reports
2. Casella’s CEL-633.A1—Class 1 sound level meter (environmental kit)

- Survey-grade accuracy with environmental kit options
- Configurable time-history logging for compliance windows
- Well-suited as a fixed node at sensitive receptors
3. RAE Systems’ QRAE 3—Wireless four-gas monitor

- Wireless-ready for live alarms during tasks
- Rugged build for industrial environments
- Complements fixed nodes in a blended EMS
4. RAE Systems’ MultiRAE Plus—Advanced multi-gas platform

- Configurable sensor suites for varied risks
- Rugged design with audit-ready logging
- Pairs with gateways to publish to the EMS
Deployment Models
How you deploy an environmental monitoring system shapes its reliability, cost, and scalability.
Choosing the right model for your needs will depend on:
- Your site(s)
- Risks at your site(s)
- The IT environment
Below are the most common approaches used in environmental monitoring systems (EMS) and how to choose among them for a truly continuous environmental monitoring system.

Fixed vs. Mobile Deployments
Fixed networks are permanently installed nodes and gateways designed for 24/7 operation—ideal for utilities, manufacturing campuses, and municipal perimeters. They support stable power, hardened enclosures, and predictable communications, which makes continuous coverage and low alert latency easier to achieve.
Mobile kits are portable hubs and sensors you can drop into a site for weeks or months—useful for construction projects, investigations, or seasonal monitoring. They prioritize fast setup and battery-first power. To keep data continuity, look for on-node buffering and gateway caching so gaps don’t appear when connectivity changes during moves.
How to decide: If your risk is ongoing (e.g., community PM or plant noise), go fixed. If your need is temporary or you move from job to job, start with mobile and standardize a redeployable kit.
Single-Site vs. Multi-Site Systems
Single-site systems monitor one facility or campus. They’re simpler to operate and a good starting point for an environmental monitoring system project or pilot. You can still segment zones—production, loading, perimeter—to align alarms with response teams.
Multi-site systems unify many facilities under one platform. Centralized dashboards compare trends, alarms, and device health across locations. Role-based access control keeps local teams focused on their sites while corporate EHS sees the portfolio. This model fits fleets of substations, data centers, or water facilities and is the natural next step after a successful pilot.
Cloud, On-Premise, and Hybrid Architectures
Cloud-hosted means your platform runs in a managed cloud. You get elasticity, fast updates, and easy remote access.
On-premise means the platform runs inside your network—often chosen for strict data residency, pharma/validated environments, or where IT requires complete control.
Hybrid combines local processing (edge or on-prem) with cloud analytics and archiving.
| Modèle | Strengths | Tradeoffs | Best Fit |
|---|---|---|---|
| Cloud-Hosted | Scales quickly; remote access; reduced maintenance; rapid feature updates | Internet dependency; data residency/policy reviews needed | Multi-site portfolios; mobile projects; fast time-to-value |
| On-Premise | Local control; supports strict validation; internal network performance | Higher IT effort; upgrades/change control; scaling can be slower | Pharma/cleanroom, high-security plants, regulated data residency |
| Hybrid | Local processing + cloud analytics; resilient to outages; flexible data flows | More architecture planning; integration mapping required | Distributed utilities, smart cities, mixed IT policies |
Redundancy & Offline Operation
Continuous doesn’t just mean “24/7 sensors”—it means your data pipeline literally never sleeps.
Build resilience into each layer:
- Power: UPS or PoE for critical nodes (common in server rooms and data centers).
- Comms: dual-path networking (e.g., Ethernet + LTE-M), multiple gateways per zone, and SIM failover.
- Edge buffering: on-node storage plus gateway caching so measurements backfill after outages.
- Platform health: watchdogs and alerts for “last contact,” high latency, or data gaps.
Definitions: “Failover” is an automatic switch to a backup path when the primary fails. “Offline mode” means nodes keep logging and later sync so you don’t lose records.
Phased Rollouts & Continuous Monitoring
Most teams start with a pilot at one site or zone to validate comms, data quality, and alert logic.
Next, they expand coverage to additional areas and refine thresholds and workflows.
Finally, they execute a multi-site rollout with standardized configurations, RBAC, and reporting so results are comparable across the portfolio.
Throughout each phase, keep QA/QC in view—calibration tracking, verification rules, and audit trails—so your continuous environmental monitoring system produces data you can stand behind.
Here are some quick examples:
- A construction program might use mobile noise and dust kits with cellular gateways
- A regional utility may use fixed LoRaWAN nodes at many substations under one cloud platform
- A data center may prefer PoE sensors on an on-prem or hybrid system for maximum uptime.
If you frame your environmental monitoring system project with these deployment choices in mind—coverage, hosting, redundancy, and rollout—you’ll have a system that scales smoothly while keeping alerts timely and data defensible.
Data Quality (QA/QC) in Systems
A continuous environmental monitoring system doesn’t just collect data—it constantly checks its own work. QA/QC is embedded so measurements stay accurate, complete, and defensible across sites and over time.
System-level QA/QC reduces manual effort, speeds investigations, and ensures alerts and reports reflect reality, not noise.
QA/QC At-a-Glance
| Pillar | Objectif | Key Actions | What Success Looks Like |
|---|---|---|---|
| 1) Automated Checks & Drift Detection | Catch bad data before it drives alarms or reports | Range/plausibility, spike/flatline, drift vs. baselines or references; health correlation | Low false alarms, early issue detection, fewer field visits |
| 2) Calibration & Traceability | Prove instruments were in control when data was recorded | Certificates, due dates, pass/fail results; auto-quarantine overdue devices; lineage tags | Audit-ready records; overdue devices excluded from compliance outputs |
| 3) Validation & Audit Readiness | Formalize decisions on flagged data and configuration changes | Reviewer queues, versioned configs, release states for “approved for reporting” | Clear chain of custody; consistent, defensible reports across sites |

1. Why QA/QC Matters
Distributed sensors operate in the real world—temperature swings, power blips, and human factors can nudge readings off course. Without embedded QA/QC, small issues become blind spots or false alarms. A well-designed environmental monitoring system uses automated checks, calibration tracking, and transparent records so teams can trust the data behind decisions and audits.
Three concepts guide the approach:
- Drift: a gradual change in sensor response away from true values.
- Traceability: a documented chain back to known references, methods, and calibrations.
- Data lineage: the who/what/when/where of each data point (device, firmware, validation status, transformations).
2. Automated Checks & Drift Detection
Modern platforms validate streams as they arrive, flagging suspect values before they trigger alarms or enter reports. Automation catches issues early and at scale—across hundreds of nodes and millions of points.
The chart below outlines key QA/QC checkpoints and how they keep an environmental monitoring system reliable:
| Automated QA/QC Feature | Objectif | Typical Outcome |
|---|---|---|
| Range & Plausibility Checks | Block impossible values (e.g., negative RH) and out-of-spec readings | Flags data points; prevents spurious alarms |
| Spike & Flatline Detection | Identify sudden jumps or stuck sensors | Auto-tag for review; notify device owners |
| Drift Monitoring | Track slow deviation from baselines or collocated references | Recommend calibration/maintenance |
| Status/Health Correlation | Relate anomalies to battery, signal, or last contact | Faster root cause; fewer field visits |
| Rule-Based Validation | Apply site- and parameter-specific logic (e.g., rolling averages) | Consistent screening across sites |
3. Calibration & Traceability
Calibration management is the backbone of defensible data. The platform should track certificates, due dates, methods, and pass/fail results for every instrument, then enforce rules that quarantine or tag data from devices that fall out of calibration.
- Centralized records link instruments to serial numbers, firmware versions, calibration history, and owners.
- Reminders and locks prevent overdue devices from contributing to compliance reports.
- Data lineage tags each value with device ID, timestamp, validation status, and any transformations (e.g., temperature compensation).
When audits or investigations arise, you can show not only the measurement, but also how it was produced, by which device, under which configuration, and with what validation outcome.
4. Validation & Audit Readiness
Good QA/QC is both technical and procedural. Validation workflows formalize how flagged data is reviewed, approved, or excluded—and by whom. Change management logs every adjustment to thresholds, alarm logic, and validation rules so reviewers can see when policies changed and why.
- Review queues route flagged data to subject-matter experts for disposition with comments.
- Versioned configurations capture changes to limits, formulas, and device mappings.
- Release steps mark datasets as “approved for reporting,” separating operational streams from audit-ready records.
Across multi-site deployments, these practices make portfolio reports comparable and reduce one-off justifications. The result is practical confidence: a continuous environmental monitoring system that protects data quality automatically—so teams can focus on action, not cleanup.
Analytics & Reporting
An environmental monitoring system turns raw sensor feeds into clear, defensible decisions. Analytics connect the dots—capturing data, finding patterns, and presenting results in ways that the right people can act on. Rapports closes the loop by packaging those insights for daily operations, management reviews, and audits.
1. Turning Data into Decisions
The path from measurement to action looks like this: capture → analyze → visualize → report → respond. A continuous environmental monitoring system automates that flow, so you’re not stitching together spreadsheets after the fact.- Data arrives with validation status and lineage.
- Analytics apply rules and context
- Reporting dashboards show what matters
- Alerts and reports make sure this information is seen and documented
2. Dashboards, Trends & Visualization
Dashboards turn live data into understanding at a glance. Configure views by audience—operators, EHS, quality, management—so each team sees the KPIs that matter to them. Overlay parameters to spot relationships (e.g., PM and wind), show heatmaps for hotspots, or place readings on a map or floor plan for location context.- Configurable cards: live values, status badges, and spark lines for key metrics.
- Trend tools: rolling averages, seasonality views, percentile bands, and compare-by-zone or by-site.
- Geospatial layers: pin sensors, draw zones, and visualize gradients around facilities.
- Drill-downs: click a panel to see time-series, QA/QC flags, and device health for root cause analysis.
3. Alarms, Workflows & Notifications
Alerts translate thresholds into timely action. Use instant triggers for acute risks, or rolling averages for programs that rely on stabilized metrics. Multi-parameter logic (e.g., noise et vibration) can reduce false positives. Notifications route via email, SMS, or in-app, with escalation if an alarm isn’t acknowledged within your target response time.- Alarm logic: instant, rolling, rate-of-change, and multi-condition rules.
- Workflows: auto-assign tasks, open a maintenance ticket, and require acknowledgment.
- Escalation: time-based handoff to supervisors when alarms sit unaddressed.
- Evidence: attach photos, notes, and corrective actions to close the loop.
4. Automated Reports & Continuous Improvement
Reporting ensures consistent communication across teams and sites. Schedule daily or weekly summaries with alarms, trends, uptime, and calibration status. Build audit packs that include change logs and signatures. Management views roll up KPIs—exceedances, response times, and availability—so leaders can compare sites and track improvement over time.- Templates & scheduling: standardize sections and deliver to distribution lists automatically.
- KPIs: uptime, alarms acknowledged, time-to-resolution, calibration on-time rate, data gaps.
- Comparatives: before/after views to verify that mitigations or process changes are working.
- Export options: CSV for analysis, PDF for stakeholders, and machine-friendly feeds for BI tools.
| Capability | What It Does | Typical Outcome |
|---|---|---|
| Dashboards & Overlays | Live KPIs, parameter overlays, heatmaps, geospatial views | Fast situational awareness; hotspot identification |
| Trend & KPI Analysis | Rolling averages, seasonality, cross-site comparisons | Evidence for decisions and program tuning |
| Alarms & Workflows | Threshold logic, routing, acknowledgment, escalation | Timely response; documented corrective actions |
| Automated Reporting | Scheduled summaries, audit packs, exports | Consistent communication; audit-ready records |
| Lineage & Defensibility | Data tagging, validation status, change logs | Confidence in findings; smoother inspections |
Selection Guide & Decision Tree
There isn’t a single best environmental monitoring system.
The best fit is the one that meets your outcomes with reliable data, clear alerts, and manageable costs. Use this guide to translate goals, constraints, and IT realities into a continuous environmental monitoring system you can defend—and scale.
1. Start With Outcomes
Start by naming the job your system must do. Most environmental monitoring systems (EMS) serve one or more of these outcomes:
- Worker exposure vs. ambient/community: Are you protecting people on the job, demonstrating perimeter stewardship, or both?
- Product/process control: Do you need tight control of cleanrooms, server rooms, or production lines where conditions affect quality or uptime?
- Compliance vs. optimization: Are you primarily meeting regulatory thresholds, or also driving operational improvement with analytics and reports?
Clarify success metrics up front—latency targets (how fast alarms must fire), data continuity (acceptable gaps), reporting cadence, and who owns each alarm.
Decision Tree
- Scope your sites: One facility or many? If multi-site, centralize dashboards and role-based access from day one.
- Define latency & continuity: Acute risks (e.g., leaks, temperature excursions) need low-latency alarms and resilient comms; trend programs tolerate longer intervals if data continuity is strong.
- Pick a deployment style: Ongoing risk → fixed network; temporary or investigative → mobile project kit; mixed portfolio → blend both.
- Choose hosting: Cloud for agility and multi-site scale; on-prem for strict data residency/validation; hybrid to compute locally and analyze in the cloud.
- Plan communications: LoRaWAN for wide coverage and long battery life; LTE-M/5G for backhaul and speed; Wi-Fi/PoE for buildings and data centers. Always include edge buffering.
- Confirm QA/QC maturity: Require automated validation, calibration tracking, and audit trails if you’ll publish or defend data.
- Integrate early: Map CMMS/EHS/GIS connections and decide where alarms become work orders. Integration costs can rival hardware if left late.
Examples (to guide your choice):
- City PM network: Favors a multi-site cloud portfolio for comparability and centralized oversight.
- Cleanroom/validated lab: Favors an on-prem or hybrid validated environment for control, change management, and e-records.
- Data center/server rooms: Often pairs PoE/Wi-Fi sensors with on-prem or hybrid platforms for uptime and local control.
2. Recommended System Patterns
Use these patterns to scope your environmental monitoring system project. Each pattern assumes automated QA/QC, device health monitoring, and data lineage out of the box.
- Mobile Project Kit: Portable hubs and sensors for construction phases, investigations, or seasonal studies. Cellular backhaul, battery-first design, aggressive buffering. Fast to deploy; best when sites change often.
- Fixed Single-Site (Cloud): Permanent nodes and gateways at one facility. Mix of PoE/Wi-Fi indoors and LoRaWAN outdoors. Cloud analytics and scheduled reports for plant teams and management.
- Multi-Site Cloud Portfolio: Standardized configuration across many facilities. Central dashboards compare alarms, KPIs, and uptime. Role-based access keeps local focus while enabling corporate oversight.
- On-Prem/Hybrid Validated Environment: For pharma/cleanroom or high-security data centers. On-prem platform (or hybrid edge) for control and data residency; cloud optional for non-validated analytics and archiving.
| Pattern | Primary Use Case | Typical Latency | Resilience | Integrations | Relative Cost |
|---|---|---|---|---|---|
| Mobile Project Kit | Construction noise/dust, short-term studies | Minutes | Edge buffering; single gateway; battery backup | Basic (CSV/PDF, light webhooks) | Low–Medium |
| Fixed Single-Site (Cloud) | Plant perimeter, indoor microclimate, utilities | Seconds–minutes | Multiple gateways; UPS/PoE; dual-path backhaul | Moderate (EHS/CMMS, scheduled reports) | Moyen |
| Multi-Site Cloud Portfolio | Regional utilities, municipal networks, enterprises | Seconds–minutes | Standardized configs; health SLAs; fleet analytics | High (RBAC, BI feeds, enterprise SSO) | Medium–High |
| On-Prem/Hybrid Validated | Pharma cleanrooms, validated labs, secure data centers | Seconds | Local compute; strict change control; redundant power/comms | High (Part 11, audit trails, e-signatures, CMMS) | High |
Common Pitfalls To Avoid
- Underestimating coverage: LoRaWAN range varies by terrain and buildings; plan site surveys and consider more gateways than you think you need.
- Skipping buffering: Without on-node and gateway caching, connectivity blips turn into permanent data gaps.
- Unowned alarms: Define who acknowledges, who fixes, and how escalation works before you go live.
- Neglecting calibration lifecycle: If overdue devices aren’t blocked or tagged, you risk non-defensible data in reports.
- Late integrations: Delaying CMMS/EHS connections leads to manual workarounds and lost accountability.
- Chasing features over fit: The best environmental monitoring system is the one you can operate—reliably, repeatably, and within budget.
Follow this path—outcomes, latency and continuity, deployment style, hosting, comms, QA/QC, and integrations—and you’ll scope an environmental monitoring system project that delivers trustworthy alerts and reports today, and scales cleanly tomorrow.
